From the desk of Jonathan Evans·Brisbane, Australia
Build and extend Gann's Financial Time Table instead of copying dates from it.
Gann's printed table covers 1784 to 2008, but it does not explain the construction rule behind the rows. This letter shows the rule, the anchor correction, the 224-year historical test, and what the course teaches you to do after the printed table ends.
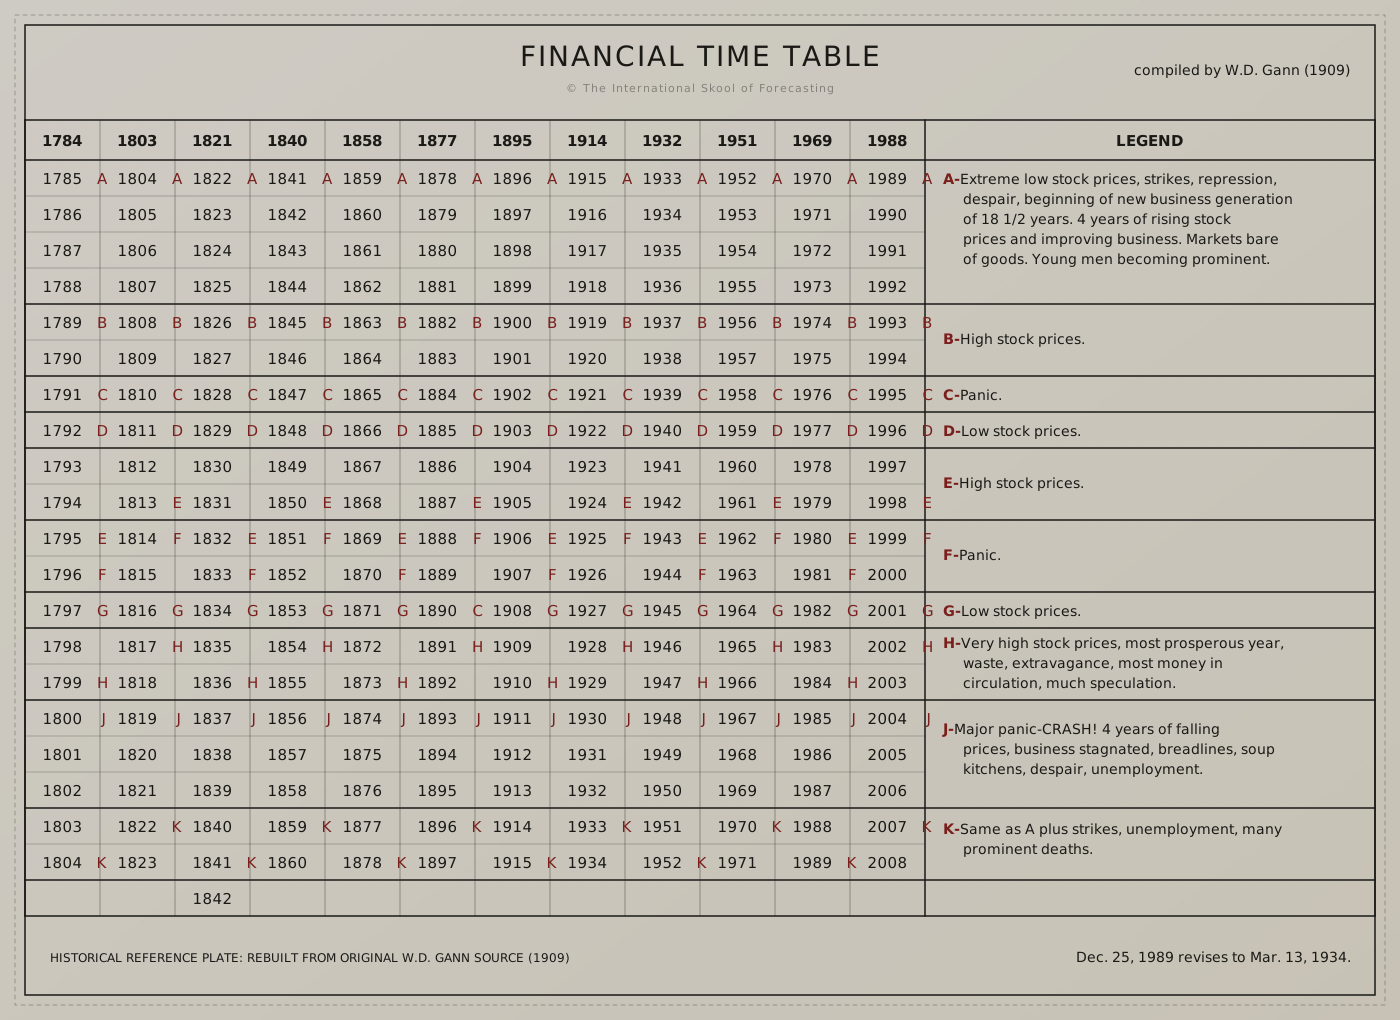
Let me be precise about what the Financial Time Table is, because it is routinely oversold. It is a single grid. Down the left runs a legend of ten letters, A through K, each naming what a year does — extreme lows and strikes at A, high prices at B, panic at C, the prosperous apex at H, the major crash at J, the bottom at K. Across the top runs a header row of years in an alternating 18-year, 19-year sequence. Read down a column and you watch a cycle unfold.
Gann produced that grid covering 1784 through 2008. Every serious student of his work has seen it. Almost none of them can tell you what makes the columns alternate the way they do, and that is not an accident — Gann never put the rule in writing. Without it, the table is an artefact you quote. With it, the table is an instrument you can rebuild, correct, and carry forward indefinitely.
This letter is about the rule. Not a list of copied dates — those are freely available and worth roughly what you pay for them. The construction logic: how the page was built, why the printed version drifts out of alignment, how the correction is verified against the historical record, and what the whole thing reads once you extend it past where Gann stopped writing.
One warning before you continue. This instrument works in years, not days. It will tell you what kind of year you are standing in. It will not give you an entry on Tuesday morning, and anyone selling you a long cycle as a trade-timing tool is misrepresenting it. If precise turn dates are what you need, stop reading this letter and go look at Time by Solar Degrees instead — that is the right course for that job, and I would rather point you at it than take your money for the wrong one.
Optional 3–8 min. Author intro, or a proof-of-concept demonstration.
What this letter covers
— The line in Gann's own margin that almost nobody quotes correctly, and why it is not the erratum everyone assumes it is.
— Why the printed table drifts, where the anchor was measured wrong, and what happens to the whole sequence once you correct it.
— The 20-year cycle Gann named but never explained. He put a length on it — 240 months — and stopped there. Readers have been arguing about what drives it ever since.
— What 224 years of testing actually produced — including the roughly one-third of cycles that needed correcting, and the rule that corrects them.
— The year the method got it flatly wrong. 1948. Named, shown in full, and not rescued by any of the overlays.
Before you continue
Decide quickly whether this is the right course for you.
This is a construction course. You rebuild Gann's Financial Time Table from first principles, test it against the historical record, and learn to extend it beyond the printed dates.
You learn
The six-chapter construction sequence, ephemeris grounding, recalibration, and extension past 2064.
Proof to inspect
The 1784–2008 record, the 1929–33 phase labels, and the October 2008 peak marked to within a week.
Important limit
The record includes an outright 1948 miss. The timetable is a research instrument, not a guaranteed crash clock.
Terms
AUD $897 once. Lifetime access after verification. No change-of-mind refund after access; Australian Consumer Law rights remain.
§ The broken tool · Why most researchers stop at 2008
The published timetable is a snapshot of the cycle. It is not the method that produced the snapshot.
A table of historical phase dates is a photograph of the cycle. The logic that produced it is a different thing entirely. The photograph stops at 2008. The logic doesn't. But Gann never published that logic in a form you could extend. What he left you is the output — not the instrument that built it.
"The original dates ran out. So I went back to the construction, not the table." — Jonathan Evans
That gap matters in four concrete ways.
01
Drift
The mechanical 18/19-year alternating sequence accumulates roughly 0.1 years of error per cycle. Over five cycles that is a half-year error. At the cycle boundary you are looking for the turn in the wrong season.
02
The endpoint problem
The published timetable runs to 2008 with no construction notes beyond it. Without a construction method, you either stop at 2008 or extrapolate mechanically without recalibration. The drift from the previous card compounds with every cycle you push forward.
03
Decoupling
From 2009, central bank policy inflated stock prices above the business cycle's natural level. The timetable tracks the business cycle — not the index. If you conflate the two, you read the wrong signal at the wrong time.
04
The Hidden Cycles
Gann embedded additional corroboration layers inside the same columns but never named them plainly in any published work. If you read only the visible line, you read one signal where the table is carrying several — and you have no way to tell a phase boundary two layers agree on from one that rests on a single reading.
A working timetable needs six things, in this order: the physical cycle underneath the columns, Gann's original construction, the recalibration step that closes the drift, the hidden corroboration layers, my own long-cycle research, and an extension method past the printed table. The next section is how each one works and what it feeds.
§ The method — built in 6 layers
Gann published the second layer. Here are all six, in the only order they can be built in.
Gann documented the timetable's outputs. He did not document the construction logic in one place. In this course I assemble that logic for you — from the astronomical source, through the original build, through the correction, to extension and corroboration.
The timetable stopped at 2008. The cycle did not. That contradiction had to be resolved.
In 2017 I was running Gann's original 18/19-year alternating sequence against US price records from 1800. The sequence worked through the early cycles. Then the phase boundaries started drifting against ephemeris data. A turn the mechanical sequence placed in October was landing in April. The error was small — less than a year — but it compounded across cycles.
I traced the drift to the re-anchor step. Gann had noted the re-anchor events, but the older ephemeris data placed the anchor slightly off. A modern ephemeris closes the drift. Once corrected, the timetable lines up with the documented crisis low closely enough to make the construction testable. The course walks you through that verification from the instrument itself, not from a list of copied dates.
1
The primary cycle — the engine Gann never named
Gann was not counting years. He was tracking a physical cycle, and the alternating 18/19 columns are that cycle rounded to whole years. The timetable is not a pattern built from arbitrary intervals; it is a record tied to a real astronomical rhythm. In The Engine Gann Never Named chapter, you learn to read that source from first principles using a free ephemeris.
"The cycle is not invented. It is the period of a real, measurable cycle — 18.6 years, measured from any starting point." — from the course
2
Original construction — the 18/19 alternating sequence
Gann approximated the cycle in a mechanical sequence that produced the published table. In the construction chapter you reconstruct that sequence from scratch. You end with a spreadsheet that matches Gann's published version and lets you check the rows against the original. This baseline becomes your comparison point for the recalibration step.
3
The correction that closes the drift
This is the correction the discovery story above describes. Apply it and the drift that accumulates in the printed version is resolved. In the construction chapter I walk you through the verification step so you check the arithmetic yourself — not on my word, on yours.
4
The cycles Gann hid inside the same columns
Gann embedded additional corroboration layers in the published table without naming them plainly. Each layer carries its own phase boundaries, and the column codes mark where they fall. If you read only the visible line, you read one signal where the table is carrying several. In The Corroboration Layer I surface the layers and teach you the reading rule that separates the textbook interpretation from the working one.
"One thing that Gann did hide inside his financial timetable was another cycle." — Jonathan Evans
5
The long-cycle layer
Underneath the visible table sits my own long-cycle research. The sales page does not publish the pair list or the construction. Inside the course, you see how the layer is identified, checked against historical turns, and used as corroboration for forward economic-cycle work. No published Gann source hands you this layer.
"We're the only ones that have ever talked about this theory. No one in the Gann sphere has picked it up." — Jonathan Evans
6
Phase interpretation and extension past the printed table
Each timetable entry carries a phase label — the alphabet of one full primary cycle. Each phase has a named pattern attached to it. The Mid-Cycle Slowdown around year nine, when the primary cycle pauses and tests the foundations of the bull market. The Winner's Curse at the H-phase peak, when the most spectacular gains arrive at the point of maximum risk and the prevailing narrative becomes "this time is different." The J-phase warning before the contraction. In the Modern Application chapter I teach you each pattern against the business cycle, not the stock index. From there, extension is no longer guesswork — you run the construction forward and add entries for future cycles yourself.
"The most spectacular gains are often made during this phase, a phenomenon that lures the last cohort of skeptical investors into the market at the point of maximum risk just before the cycle inevitably turns." — from the course, on the Winner's Curse
§ The proof walk
The pre-1909 labels are a fit to history. The post-1909 labels are the actual test.
The proof is the record. Each case below matches a documented phase label to a documented price event from NYSE history. In the backtest chapter you replicate this and produce your own verified record.
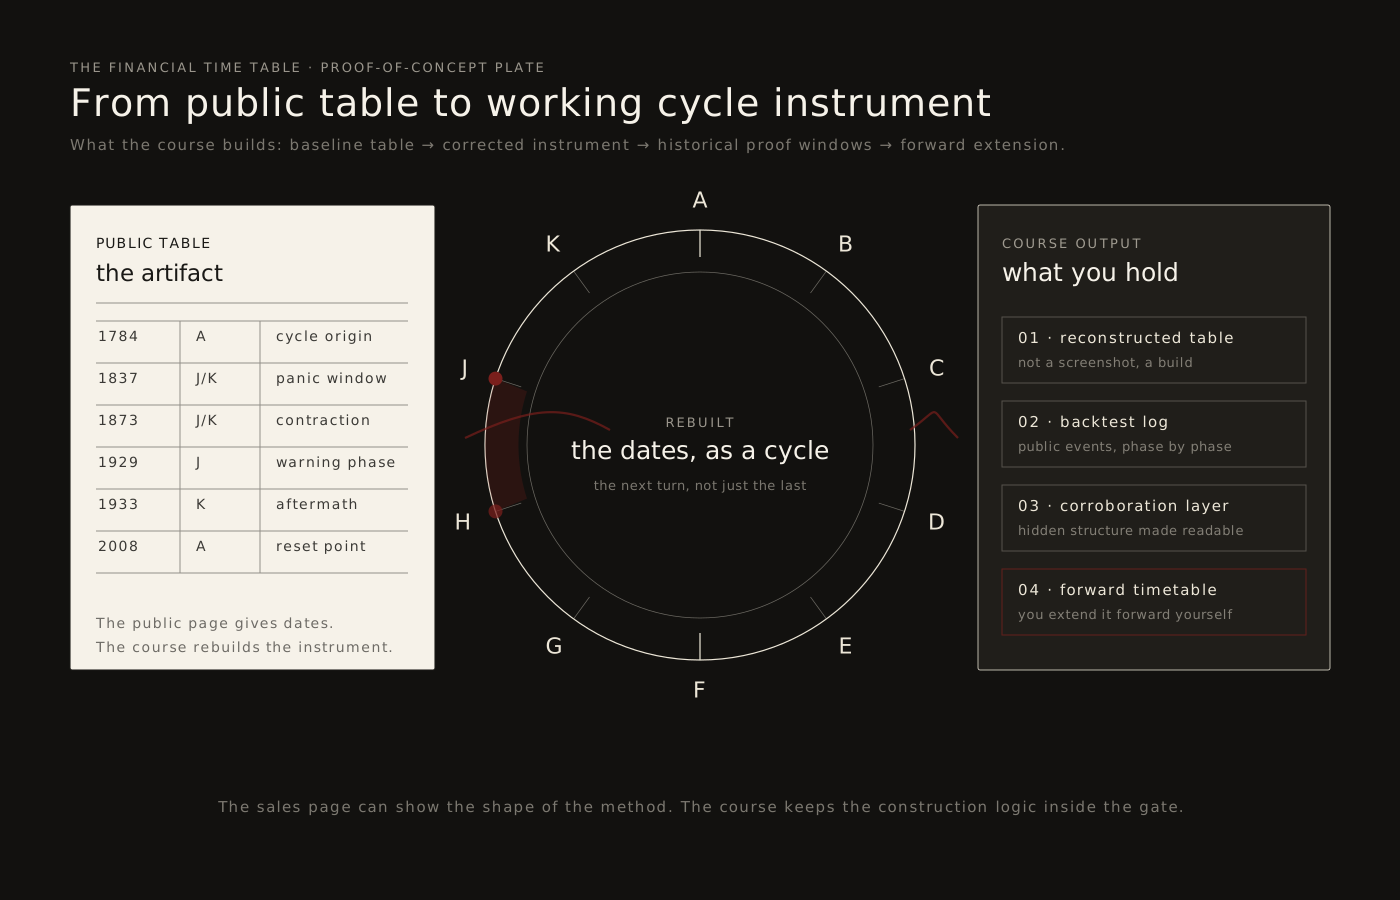
The shape of the work: public table → rebuilt instrument → proof windows → forward timetable
1929–1933
The instrument called the Great Depression
Every price and economic marker from 1929 to 1933 matched the J-phase and K-phase labels.
The H phase — most prosperous, peak speculation — ran through the late 1920s on the timetable's schedule. The J-phase transition (major panic, four years falling) began in 1929. The Dow peaked at 381.17 on 3 September 1929 and closed at 41.22 on 8 July 1932 — a fall of 89.2 percent. It did not regain the 1929 high until November 1954. The K phase (unemployment, economic contraction) followed the label exactly. The H-phase stock inflation and the underlying business cycle had diverged through the 1920s — the J-to-K transition is when they converged. This is one of twelve full cycles I walk you through in the backtest chapter.
2008–2009
The corrected sequence marks the October 2008 credit-crisis peak
The recalibrated timetable is tested against the GFC low, not asserted as a belief.
In the course, you rebuild the recalibrated timetable and test it against the documented October 2008 credit-crisis peak, which the rebuilt instrument marked to within a week. The point is not that you memorise a date from this page; it is that you learn the construction well enough to verify the instrument yourself.
Original research
The long-cycle layer no Gann book hands you
The long-cycle layer is checked against the historical record before it is used as a forecast tool.
Inside the course, you see the historical pair structure and the construction logic that produces it. The page does not publish that list because the list is part of the working method. What matters here is the outcome: the long-cycle layer gives the timetable a corroboration system no published Gann source hands you.
"We're the only ones that have ever talked about this theory. No one in the Gann sphere has picked it up." — Jonathan Evans
What the static published table gives you
One cycle. Ending at 2008. With no method to extend it.
One cycle (the primary)
Last entry: 2008
No construction method, no recalibration
No hidden cycles surfaced
No long-cycle layer
What this course gives you
Visible cycle, hidden corroboration, forward extension. Verifiable by you.
Primary cycle, recalibrated to close the drift
The secondary 20-year cycle Gann hid in the same columns
The secondary 30-year return layered into the same table
My own long-cycle research and its historical corroboration layer
Construction method that extends every cycle forward and beyond
Gann published one cycle layer. The course shows you the additional layers and how to extend the timetable.
The rest of this letter handles objections and explains the offer. Some readers do not need either. If the method and terms are clear, you can enrol here.
AUD $897 · One payment · Lifetime access · No change-of-mind refunds once access is released — this does not limit your rights under the Australian Consumer Law
§ But modern markets are different
The stock index was distorted. The longer business cycle still provides a test.
This is the objection you're going to raise. Stock prices rose through phases the timetable labels as contraction periods. The S&P 500 hit all-time highs in years the timetable marks as economic stress. If the timetable tracks the economic cycle, why did the stock index ignore it? The objection is real. You deserve a mechanism — not a reassurance.
"From 2009, central bank quantitative easing and zero interest rates inflated stock prices above the level the business cycle would have produced. The stock index and the business cycle decoupled." — from the course
The timetable tracks the business cycle — not the stock index level. The two separated after 2009, and underneath the separation the phase sequence still ran in order: the mid-cycle slowdown across 2018–2020, the low in 2022, the H prosperity expansion through 2023–2024.
Now the sentence that has to sit directly next to that one. The construction those labels come from was written down in 2023, and I am reading it backwards against a record that already existed. Nobody documented a call ahead of any of those years, I am not going to phrase it as though somebody did, and if that costs the paragraph half its force — good. That force is the exact thing you should refuse to pay for.
What the post-2009 stretch does establish is the mechanism, and the mechanism is the part you can use. The index inflation that ran on past those years was sustained by policy, not by organic business cycle conditions. The real economy went the other way: weak wage growth, flat productivity, repeated recessions in the non-financial sector that never once registered in the index. At the next J phase the two lines start to converge. At the K phase that follows, the gap closes.
"Policy can inflate a price level. It cannot sustain a business cycle position past its phase boundary. The K phase is when index prices and real economic conditions converge." — from the course
The 1873 case shows the same convergence. Rail speculation in the early 1870s inflated prices above what the underlying business cycle supported. The J-phase transition arrived on the timetable's schedule, producing the Panic of 1873 and a four-year contraction that removed the speculative excess. The GFC case shows the same mechanism in a different era: the recalibrated table marked the cycle reset while the stock index was still being driven by panic. The stock index recovered through QE by 2013. The business cycle followed the timetable's schedule regardless.
The grid every reader has seen → years down the columns, letters across the phases → none of it holding the rule that built it
The important miss: the 1948 cycle turn.
I have just spent two thousand words telling you what this instrument does well, and you should be suspicious of that, so here is the case that does not work.
1948 is the clearest outright miss in the entire 224-year record. The label called for a late-cycle crash. The market inverted instead and ran higher into the 1950s. No overlay rescues it. Not the 20-year layer, not the 30-year layer, not the two-century overlay — I have tried all three, and the honest answer is that the phase label and the market disagreed and the market was right.
I am not putting that here to seem candid. I am putting it here because of what it does to every other number on this page. A method tested across twelve cycles that its own author reports as flawless has not been tested; it has been curated. This one failed once, plainly, in a year I can name — and you will meet 1948 in Chapter 3 on screen, in the same format as 1929 and 2008, with no softening. It is the reason I can ask you to take the rest of the record seriously.
Which brings us to the part of the record that holds.
§ Why now
1837. 1857. 1873. 1929. 1987. 2008. Every one sits in the same phase of the same sequence — and the published table stops at the last.
The cycle does not skip turns because central bank policy changes. It has run on the same schedule since 1784, and every major contraction in the 224-year record sits somewhere on the timetable. Now the caveat that matters, because it is the one this genre normally swallows: nobody was holding this instrument in 1837. The page was printed around 1908. Everything before that is a fit to history Gann already had in front of him, and the only labels that constitute a test are the ones from 1909 forward — 1929 and 2008 among them, 1948 against them. Roughly a third of the twelve cycles needed the correction rule applied first. You will see which third, and the rule, before you see the results.
Which brings us to the part where most letters like this one would hand you a date. I am not going to. Publishing a dated market call is how a research business turns into a tipping service, and it also asks you to trust a number instead of a method. What the course does instead is put you in a position to run the corrected sequence yourself on whatever year you are standing in, see which resolutions the framework allows, and weigh them against the second pattern running underneath — the decade rhythm that stresses years ending in seven (1857, 1907, 1987, and the 2007 top). That pattern is not clean either: 2017 was one of the quietest years on record. You will learn where the two agree, where they diverge, and how much either is worth.
I want to be careful here, because this is exactly the point where a sales letter usually overreaches. That reading is not a promise and I am not asking you to trade on it. It is the output of a method, and the entire purpose of the course is to put you in a position to produce that output yourself, check my working, and disagree with me if the evidence takes you somewhere else. A forecast you cannot audit is worth nothing. The point of building the instrument is that you never have to take anyone's word for the reading again — including mine.
Once you have the recalibration in place, your timetable carries a phase label for every cycle the ephemeris can calculate. The 2006–2009 J-to-K transition ran on schedule and ended with the global financial crisis and the most severe six-month stretch of job losses since 1945. The phase label for that interval — J, the warning before the major panic — matched the documented outcome. The same pattern is in every cycle on record going back to 1784.
Anyone who reached for the timetable once the GFC was obvious was reading a phase that had already resolved. That is history, not an instrument. Every window works the same way: the reading is only worth doing from inside the phase, and you cannot get inside a phase you have not yet built the tool to measure.
§ Why this is gated
A research skill you build, not a signal service.
The construction method behind this timetable took me years of independent verification. The long-cycle layer took longer. If I publish either openly, any publisher can repackage them without attribution — and the work loses its value for every student who paid to learn it in full. The gate protects the research and the students already inside it.
Once you have built the timetable, the skill is yours permanently. No monthly fee. No renewal. You can rebuild it from scratch for any future cycle with nothing more than a free ephemeris and the construction method from this course. The skill is yours. No subscription owns it.
When you enrol, I ask for identity verification and an NDA covering the materials and the research methodology. The review takes up to 48 hours. If I can't approve your verification, I refund your payment in full.
"If you build the timetable yourself, you have an instrument you can re-verify. If you follow a signal service, you have a feed you can't examine." — Jonathan Evans
Now the part I want you to read twice, because it is unusual and it costs me sales. There is no change-of-mind refund window on this course. Not thirty days, not seven. If I cannot verify your identity you get every dollar back — that is the one and only circumstance in which money moves backwards. No change-of-mind refunds once access is released. This does not limit your rights under the Australian Consumer Law.
The reason is not that I am inflexible. It is that a method is not a physical object. Once you have watched the first chapter you know where the anchor goes, and you cannot un-know it. A thirty-day window on a construction method is an invitation to take the rule and ask for the money back, and I have watched research like this end up repackaged under other people's names often enough to stop pretending otherwise.
So here is the trade, stated plainly. You accept that there are no change-of-mind refunds once access is released — this does not limit your rights under the Australian Consumer Law. In exchange I hold nothing back — the corrections, the failures, the roughly one-third of historical cycles that needed adjusting, the two supplementary cycles, and the capstone synthesis that is not written down anywhere else. No module withheld for a later upsell. No watered-down version. Review the offer and terms before you enrol; access is released as one complete course.
If that trade does not appeal to you, do not enrol. I would genuinely rather lose the sale than have the argument later, and this letter exists so that you can make the decision with your eyes open rather than discover the terms afterwards.
§ Six chapters — what you build
Each chapter produces the input for the next. You finish with a working timetable.
You aren't watching me do the research. You're rebuilding the instrument from its astronomical source, verifying the recalibration, and extending it past 2008 yourself. Every output in one chapter becomes the starting point for the next.
The instructor · how this course came to exist
I spent years rebuilding Gann's construction method — and found three things in it he never published.
In 2017 I was running Gann's published timetable columns against modern ephemeris data. The early cycles matched, but later phase boundaries drifted. I traced the drift to Gann's two re-anchor events — 1934 and 1989 — and re-measured the sequence with modern ephemeris data. The corrected sequence marked the October 2008 credit-crisis peak to within a week. That is the proof used in this course: a documented historical test of the rebuilt timetable, not a promise about the next market cycle. One number changed, and the accumulated drift across five cycles became easier to inspect. That was the first thing.
With the correction verified, I kept reading the published columns. I noticed something other Gann researchers had missed — the same columns carry markings for the secondary 20-year cycle and the longer 30-year layer. Gann embedded both. He never named either in any book he published. I worked out where each one falls and the buy/sell rule reversal between them. That was the second thing.
The two-century overlay took the longest. I mapped the historical sequence against its modern echo by hand — 1789 to 1804 against 1995 to 2010 — and found the same three-year, five-year, twelve-year sequence of tops in both windows, in the same order. Two windows is not a large sample and I will say so again in the lesson. But no published Gann source contains the pairing, and no other researcher I am aware of has put it in print. That was the third thing.
I built the first version of this course in 2023. I teach you the construction logic — not just the output dates — because the logic is what lets you verify and extend your own work indefinitely. If you hold the construction method, you can check every phase boundary yourself and run the timetable forward to any cycle. If you hold only the published table, you can't do either.
Construction & Recalibration
Build Gann's timetable from 1784 and verify the recalibration
Two sessions. In the first, we reconstruct Gann's original sequence from the historical anchor. By the end of it, you hold a spreadsheet with a phase label against every row from 1784 to 2008 — a working replica of the published table. In the second, I introduce my recalibration. You compute the trigger date using the degree every secondary source records, compare it to the documented October 2008 credit-crisis peak, then apply my corrected degree and run the same test. You document the difference yourself. This corrected baseline is what every subsequent chapter builds on.
Working spreadsheet: 1784–2008 phase sequence with labels A–K
Recalibration worksheet: Gann's recorded degree vs. the corrected degree
Your own corrected timetable — the foundation for extension and corroboration
The Engine Gann Never Named
Trace the primary cycle and identify its boundary positions
Here the mechanical interval gets replaced by the astronomical source. You learn where to look, what marks a cycle boundary once you are there, and you log every passage in your working file. You leave this chapter holding the construction logic, not just the constructed table — and that is the difference between a table that stops at 2008 and one you can run forward.
Your own cycle-boundary position log (1784–2008)
Fixed cross reference: the cycle-boundary positions with historical entry dates
Cycle boundary dates derived from astronomical data
The 224-Year Backtest
Walk every cycle from 1784 through 2008 against the documented market record
Now we put the timetable against data. You walk each of the twelve complete cycles from 1784 through 2008 against the documented market and economic record. For each phase label, you find the corresponding price action and document the match. In the dynamic-interpretation session I name the patterns the static label list can't show: the Mid-Cycle Slowdown around year nine, the Winner's Curse at the H-phase peak when "this time is different" becomes the prevailing narrative, the buy/sell rule reversal that separates the textbook reading from the working one. You produce your own backtest you can show to another researcher and they can replicate.
Documented backtest log (12 cycles, phase label vs. historical record)
Price and economic data comparison by phase interval
Your own verified record of the full cycle history
Modern Application & Extension
Apply the timetable to the post-2009 era and extend it past 2008
This chapter addresses the decoupling thesis directly. From 2009, quantitative easing and zero interest rates pushed stock prices above the business cycle's natural level. I show you how to distinguish what the timetable forecasts — the business cycle — from what the index displayed in the inflated post-GFC environment. We also cover the two working methods: the mechanical alternating sequence and the astrological ephemeris method. You leave knowing when to use each, and how precise each one is. In the final session I show you how to run the ephemeris forward and produce A-phase trigger dates past 2008 that exist in no published source.
Pre/post-2009 decoupling analysis (business cycle vs. index level)
How to read a J or K phase against your own cycle position, whatever it turns out to be
Two-method decision framework: mechanical vs. astrological
Extension method: producing future trigger dates from a free ephemeris
The Corroboration Layer
Surface the two cycles Gann embedded inside the same columns
Here I introduce the two supplementary cycles Gann documented inside the timetable columns but never named: the 20-year cycle Gann named but never explained and the longer 30-year layer. I show you where these cycles align with the primary signal across the 224-year record. You learn to read the supplementary columns alongside the main timetable and to spot where independent planetary cycles confirm or diverge from the primary phase label. This layer adds a second and third signal to every phase boundary, drawn from planetary mechanics independent of the primary cycle.
20-year cycle log mapped against the primary timetable
30-year return log mapped against the primary timetable
A standalone 30-year layer reference, layered on top
The Long-Cycle Layer
Walk the two-century master cycle Gann never wrote down
This is my original long-period research. The two-century alignment completes one cycle in approximately 206 years. I mapped the historical sequence against its modern echo and tested the pairing across matched two-century windows. I walk you through each pair against the historical record and teach you how to read what the master cycle implies for the tops and lows that follow it, and how to carry the structure forward yourself. Your finished instrument carries four independent signals: the primary cycle, the 20-year layer, the 30-year layer, and the two-century overlay.
The eleven paired tops mapped across the two comparable two-century windows — and why two windows is the honest limit of the sample
Phase overlay: the 30-year layer against the primary timetable
How to read what the master cycle implies for the tops and lows that follow it
Construction logic for extending the cycle forward and beyond
Illustrative comparisons only — approximate figures, not quotes from named products or services.
Two hours of private consultation with Jonathan EvansAUD $900
Three-year subscription to a comparable market cycle data serviceAUD $1,050
A comparable long-cycle methodology course from a specialist researcherAUD $2,500
Total comparable valueAUD $4,450
You pay — once, lifetime accessAUD $897
Enrol — AUD $897 →One payment. Lifetime access. No change-of-mind refunds once access is released — this does not limit your rights under the Australian Consumer Law.
§ What you walk away with
A defined capability at each step, ending in a working timetable.
Each chapter produces a deliverable you can use. The capability builds in sequence — by the time you finish the backtest you hold a verified record you produced yourself, not one you read about. By the time you finish the master cycle you hold a timetable no published source contains.
After Construction & Recalibration
Reconstruct Gann's original sequence from scratch
You have a working spreadsheet of the 18/19-year alternating sequence from 1784 to 2008, with all A-through-K phase labels assigned. You can compare every row to Gann's published version and explain the construction logic behind each entry.
After the 224-Year Backtest
Walk the 224-year backtest yourself and document it
You have a documented record of twelve complete cycles matched against the historical market and economic record. You verified the match yourself — you didn't take it on my word. The backtest file is yours to keep and show to another researcher.
After the Master Cycle
Hold a four-cycle instrument no published source contains
You have an extended timetable that reads the primary cycle, the secondary 20-year cycle Gann concealed, the longer 30-year layer, and the long-cycle layer with its historical corroboration. The instrument runs past 2008 and forward. None of these dates exist in any published Gann source.
After enrolment · Yours forever
An instrument with phase labels for cycles past your lifetime.
The timetable I generate in the master-cycle chapter runs forward. The construction method runs further than that — for any cycle the ephemeris can calculate. Lifetime access, all current materials, all updates I add over time, all future refinements as I produce them. No subscription. No renewal. The instrument is yours to pass to whoever inherits your research.
§ The documented record
No testimonials. This course has not been sold before, and I am not going to invent praise for it.
What I can put in their place is the only thing that should have moved you anyway: two cases you can check against NYSE records and published ephemeris data without my help, and replicate yourself inside the course. If a stranger's enthusiasm would have persuaded you where 224 years of price record did not, we want different things from a method.
1929–1933. The H phase — most prosperous, peak speculation — ran through the late 1920s on the timetable's schedule. The J phase label carried the warning. The K phase (unemployment, economic contraction) confirmed it. The Dow fell from 381.17 on 3 September 1929 to 41.22 on 8 July 1932 — 89.2 percent — and did not see 1929 again until November 1954. Phase label. Documented outcome. And 1929 is a genuine test: the letters were printed around 1908, two decades before the decade that filled them in. The backtest chapter walks all twelve cycles the same way.
US market & economic record, 1784–2008
Backtested in the 224-Year Backtest chapter
October 2008. The recalibrated timetable marked the credit-crisis peak to within a week. The point is not to memorise a public date; it is to rebuild the instrument and verify the correction against the record. The construction chapter walks through that verification.
Recalibration worked example, October 2008
Verified in Construction & Recalibration
§ How enrolment works · Three steps
What happens after you enrol.
1
Enrol
Complete checkout via the secure page. Your enrolment goes into my manual review queue. You'll get a confirmation by email.
2
Verify
I ask for an NDA and identity verification to protect the materials and the research. I release your access as soon as verification is complete. If I can't approve verification, I refund your payment in full.
3
Build
Open the first chapter. You reconstruct Gann's timetable from the historical anchor and verify the recalibration correction. By the end of it you hold a working spreadsheet — corrected — that becomes your baseline for every cycle layer that follows.
§ The twelve questions you should ask before you enrol
Twelve questions, answered with specifics. The last four are the ones that would stop me buying.
Do I need a background in astrology or astronomy before I start?
You don't need any prior knowledge. In The Engine Gann Never Named chapter I teach you the primary cycle concept from first principles — what it is, how it moves, and why the 18.6-year period falls out of it. The tools are a spreadsheet and an ephemeris; the mass-pressure charts, the decade cycle and the McWhirter business curve used alongside it are taught inside the course. The construction chapter starts with Gann's mechanical alternating sequence — no astronomical data required. The astronomical layer arrives next, after you've built the baseline.
Gann's original books are in the public domain. Why pay for this course?
The published timetable is freely available. This course isn't the timetable. It's the construction method behind it. You learn the hidden corroboration layers, my own long-cycle research, and the recalibration correction that closes the drift in the printed method. None of that working construction is laid out in the public-domain books. The books give you the artifact. The course gives you the instrument.
Does the timetable still work when central banks have been manipulating markets since 2009?
The timetable tracks the business cycle — not the stock index level. These two separated after 2009. QE and zero interest rates pushed the stock index above the business cycle's natural trajectory. The business cycle kept following the timetable's phase sequence. In the Modern Application chapter I show you how to distinguish cycle position from index level, and how to read the J and K phases against the post-2009 decoupled environment. The K phase is when the two trajectories converge — regardless of where the index sits at the time of entry.
What if I build the timetable and the K phase doesn't arrive in the window I expect?
The timetable identifies a year or a 12-month window — not a specific date inside that window. It doesn't guarantee a particular market event on a particular day. The cycle has run for 224 years with documented turning points at or near each phase boundary. The backtest chapter documents the residual errors across twelve cycles — you assess the historical precision range yourself rather than relying on my claim. The timetable is directional research, not a precise calendar.
Is this a trading signal service?
No. I produce no signals, no alerts, and no buy or sell recommendations. This is a research methodology course. You leave with a working timetable you built and can verify yourself. I don't tell you how to trade. I teach you to understand where you are in a long-duration economic cycle — and how to extend that understanding past 2008.
I'm not a professional analyst or economist. Is this for me?
I built this course for independent researchers — people who study long-duration cycles as a research practice, not as a professional credential. No economics degree required. No Bloomberg terminal required. The tools are a free ephemeris and a spreadsheet. The prerequisite is being able to read a table of dates and understand what a percentage price change means. If you've worked with Gann's timetable before, you're already well past that threshold.
What's actually original here that I can't find in other Gann research?
Three things. First, my own long-cycle layer and its historical corroboration. Second, the hidden cycles Gann embedded inside the same columns as the visible sequence, which the course names, surfaces, and makes readable. Third, the recalibration correction that closes the drift in the printed timetable and gives you a method for carrying the instrument forward. The page names the value; the course gives you the construction.
How long does it take to reach a working timetable?
By the end of the first chapter you have decoded the legend and walked the recalibrated sequence yourself — the core of the instrument. The spreadsheet method for projecting it forward is taught in Chapter 4, and the corroborating cycles in Chapters 5 and 6. The course is self-paced and your working files are yours to keep. I am not going to quote you a completion time, because how long it takes depends entirely on how much of the arithmetic you do yourself — and doing it yourself is the point.
You revised your own coordinates after seeing the data. What stops you revising them again to fit the next miss?
A fair question and the one I would ask. The refinements were locked in against the full backtest before any forecast for the current cycle was published — order matters, and that is the order. The widened crash window has to contain seven historical crash events spread across four separate cycles, and it does. That is a range holding up across independent instances, not one awkward case being quietly accommodated. Could the coordinates be revised again if better data warrants it? Yes, and I would rather tell you that plainly than pretend the method is finished. What I will not do is revise them to rescue a forecast after the fact, which is why the sequence is documented in the course with dates attached.
A third of your cycles needed correcting before they matched. Isn't that just explaining away the misses?
That number is in the course because I put it there, not because someone caught it. Whether it is a model or an excuse depends entirely on one thing: was the correction rule defined before or after looking at the data? Here it was defined in advance — a single stated rule about what to do when the trend is still rising on the static date — and then applied to all 224 years before any comparison was made. An adjustment applied consistently to every case is a model. An adjustment invented case by case is an excuse. Chapter 3 shows you the rule first and the results second, deliberately, so you can judge that for yourself rather than take my characterisation of it.
Stack enough cycles on top of each other and you can explain anything in hindsight.
The real test for that criticism is how many free parameters a model has — values you can quietly turn until the data fits. Here the answer is zero. The supplementary cycles are not chosen from a menu; they are the only ones matching the periods Gann stated in writing. The notation levels are fixed by geometry. The lookback band is fixed in advance. When there is no dial available to turn, "it can explain anything" stops being the objection it sounds like. The capstone has the opposite problem, incidentally, and I say so in the lesson: its cycle is long enough that the exchange's entire history only gives you two comparable windows. Two windows is worth studying and it is not worth betting the house on. You will get that distinction from me rather than a number dressed up as certainty.
What do I actually need to follow along — software, data feeds, subscriptions?
A spreadsheet and an ephemeris. The course also draws on the mass-pressure charts, the decade cycle and the McWhirter business curve, all taught inside it. No paid data feed, no software licence, no subscription to me or to anybody else. It is the reason I teach construction rather than selling dates: when the course is finished you own an instrument that costs nothing to keep running, and you can rebuild it from scratch in any future decade without me.
§ Who this is not for
Four kinds of reader will be better served by something else.
If you want a cycle signal service.
I don't send alerts. I don't produce buy or sell recommendations. I don't update you weekly with a current cycle reading. If you want a service that does those things, there are subscriptions that provide them. I teach you to build the instrument those services run on.
If you want specific trade entry dates.
The timetable identifies a year or a 12-month window. It doesn't name a day and it doesn't specify an entry price. If you need a precise date to act on, this course won't serve you. The cycle works at the scale of years.
If you are not willing to build a spreadsheet alongside the lessons.
This course produces a working artefact — a timetable you built. If you watch the lessons without building alongside them, you leave with theory and no instrument. The capability is in your working files. There is no shortcut to that.
If you need licensed financial advice.
This is a research education course. It isn't financial advice and I don't recommend any investment or trading position. If you're making an investment decision and need licensed guidance, consult a qualified financial adviser. I can't serve that need.
If you have already worked with Gann's timetable and want to own the construction method:
You build from first principles, surface the cycles Gann hid inside his own columns, verify the recalibration correction, and walk away with a four-cycle instrument that runs past 2008 — no subscription, no renewal, yours permanently.
§ The decision
Four cycles · Past 2008 · Twelve cycles backtested · Yours through future cycles
After the course, you can read and extend the next timetable phase.
"The point of building the instrument is that you can read the phase yourself and judge it, rather than accept anyone else’s reading of it. Every cycle ahead works the same way. The window is always open before the contraction. It closes the moment the headline arrives." — Jonathan Evans
Now the other side of that. Not building it has a price, and the price is not a missed year — it is that you stay a reader of other people's cycle work forever. You quote the table without being able to defend a single row of it. When someone tells you what the current phase is, you have no way to check them, and no way to tell a careful researcher from a confident one. That does not resolve with time. It resolves when you can do the arithmetic yourself, and there is no version of this where somebody hands you that.
Which leaves the plainest case of the three — what actually arrives when you enrol:
Six chapters · The full construction method
The primary cycle, recalibrated
The secondary 20-year cycle Gann hid in the same columns
The secondary 30-year return layered into the same table
The long-cycle layer — my own original research, published nowhere else
Twelve-cycle backtest log from 1784
Construction method that extends past 2008 and forward
Lifetime access after verification
AUD $897
One payment · Lifetime access · NDA + identity verification
Enrolment process — After payment, complete a two-minute identity check via Stripe (government ID + selfie) and sign a non-disclosure agreement. Course access is issued after both are reviewed.
One payment. Lifetime access. No change-of-mind refunds once access is released — this does not limit your rights under the Australian Consumer Law.
This course is educational research only. It is not financial advice and does not constitute a recommendation to buy, sell, or hold any financial instrument. The timetable produced in this course identifies phase windows measured in years — it does not predict specific market dates, price levels, or outcomes. The primary cycle — the engine Gann never named identifies broad economic phase conditions; no specific market event within any phase is guaranteed or implied. Past cycle behaviour does not guarantee future results. Enrolment is subject to identity verification and a non-disclosure agreement. Payment is refunded in full only if identity verification cannot be completed. No change-of-mind refunds once access is released. This does not limit your rights under the Australian Consumer Law.
P.S. — If you scrolled straight down here, this is the whole letter in one paragraph. Gann printed a page around 1908 that sorted 224 years of market history into ten repeating phases, and he never wrote down the rule that built it. The rule appears once, in the margin, in a line most readers dismiss as a typo: "25th of December 1989 revises to March 13, 1934." Six chapters and eleven lessons reconstruct that rule, correct the anchor Gann measured from a 1920s almanac, and walk twelve consecutive cycles from 1784 to 2008 against the documented record — including the roughly one-third that needed the correction rule applied, and 1948, the one the method got outright wrong and that no overlay saves. AUD $897, paid once, no renewal, and you finish holding an instrument you built yourself and can rebuild from a free ephemeris and a spreadsheet in any future decade. There is no deadline on this page and I am not going to invent one. The only argument for deciding now is that a timetable is worth something when you are holding it before the phase you want to read, and nobody has ever built one in a hurry. AUD $897 — Enrol now →
P.P.S. — The two chapters people underestimate are the last two. Chapter 5 is the 20-year cycle Gann named but never explained — he put a length on it, 240 months, and stopped there, and readers have been arguing about what drives it for the best part of eighty years. It has a specific, checkable answer, and once you have it the buy and sell rules follow directly from the geometry rather than from anybody's opinion. Chapter 6 is the two-century overlay, and it does not read as uniformly bearish — I want to say that plainly, because doom is the cliché of this genre and I would rather disappoint you now than sell it to you. What the overlay produces is a structure containing an extended advance as well as a contraction, and I am deliberately not going to characterise the timing of either on a sales page. You will build the overlay and read it yourself, which is the only version of it worth having.
P.P.P.S. — Two honest disqualifiers, so nobody buys the wrong thing. If you are not willing to build a spreadsheet alongside the lessons, this is the wrong purchase — there is no pre-built version, and the timetable exists in your working files or it does not exist at all. And if what you actually need is precise turn dates for entries rather than a read on what kind of year you are in, this is also the wrong purchase; go and look at Time by Solar Degrees instead. I would rather send you to the right course than take your money for this one.
Gann Financial Time TableAUD $897 · One payment · Lifetime access