The line reads: "25th of December 1989 revises to March 13, 1934." Most readers file it as a correction. The course treats it as the construction clue: the reason the table can be rebuilt as a working long-cycle instrument rather than memorised as a static list of dates.
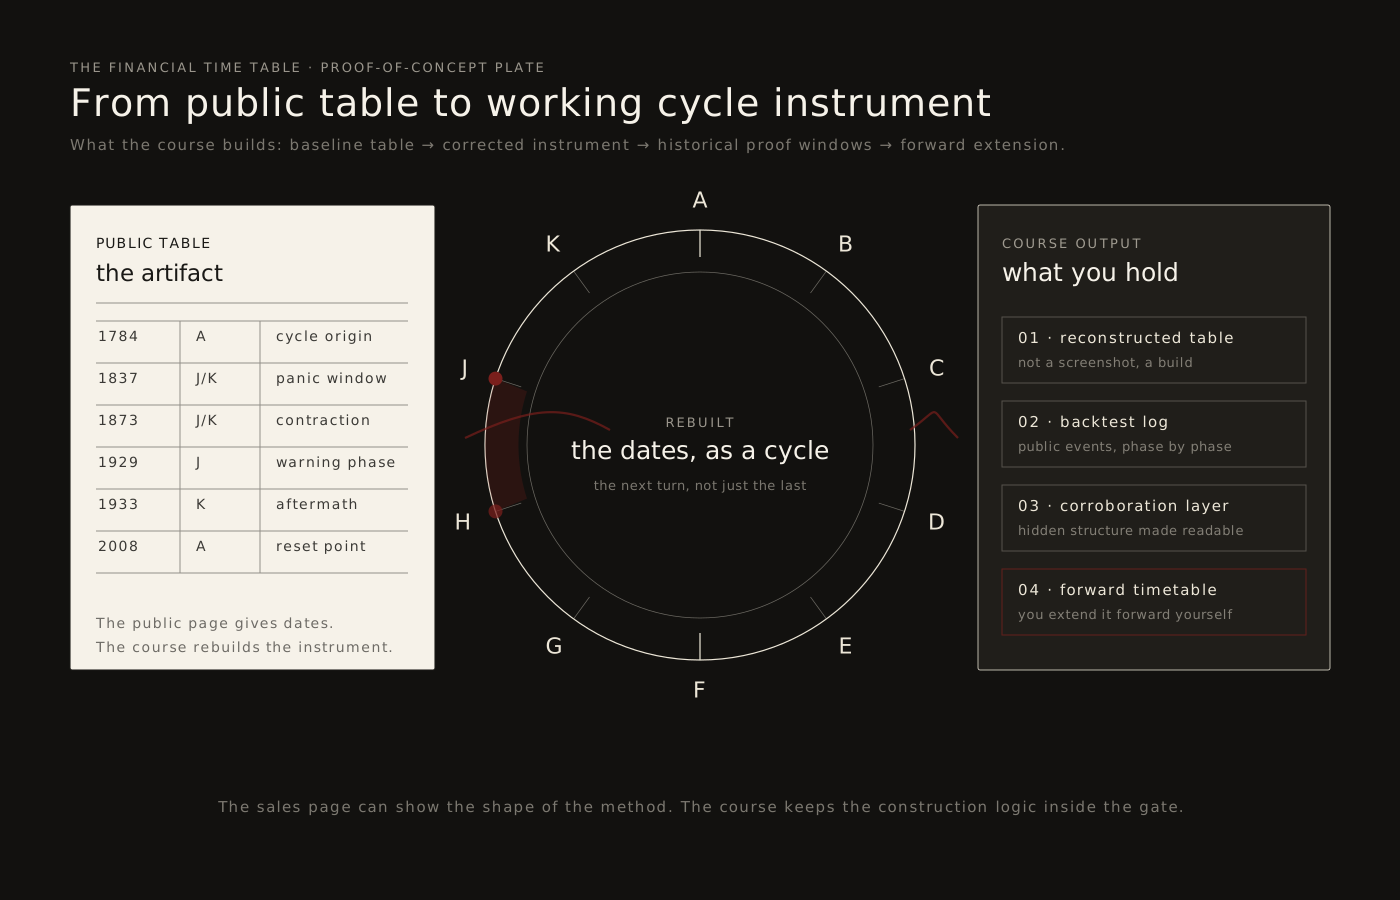
Over six chapters I reconstruct the instrument, explain its ephemeris grounding, and walk you through 224 years of market and economic record — twelve consecutive cycles, 1784 to 2008. You finish with a timetable you can check and extend yourself, including application past 2064.
I publish no dated forecast on this page. The product is the timetable: you build it, check it against the record, and extend it to the period you want to study.
Prefer the long version? Read the full research letter →
One payment · Lifetime access · Identity check and NDA required before release · No change-of-mind refunds once access is released — this does not limit your rights under the Australian Consumer Law
A is the extreme low — strikes, depressions, the bottom either in force or just behind, a new cycle launching. H is the apex: the most prosperous year, the most money in circulation, exuberance in both valuations and government spending. J is the year that follows H — the major panic, then four years of falling prices and unemployment. K closes the cycle at the bottom. Think 2008, then 2009.
In Chapter 3 I put twelve consecutive cycles on screen and walk them against the documented market and economic record, one at a time, from 1784 forward. Roughly a third of them needed a correction before the label matched the event. I show you those too, and the rule that produces the correction — which was fixed in advance and applied to all 224 years, not invented case by case.
And I want one distinction on the table before you read another line. The page was printed around 1908. Everything before that date is a fit to history Gann already had in front of him. Only the labels from 1909 forward are a test. 1929 is a test. 2008 is a test. 1837 and 1873 are not. Any letter that blurs those two things together is counting the easy half twice, and Chapter 3 keeps them in separate columns for exactly that reason.
I also show you the one it got wrong. 1948 is the clearest outright miss in the whole record. The label called for a late-cycle crash. The market inverted and ran higher into the 1950s instead, and no overlay rescues it. If a method has been tested across twelve cycles and you are told it never failed, you are being sold something. This one failed in 1948 and I would rather you heard it from me than found it in Chapter 3 after paying.
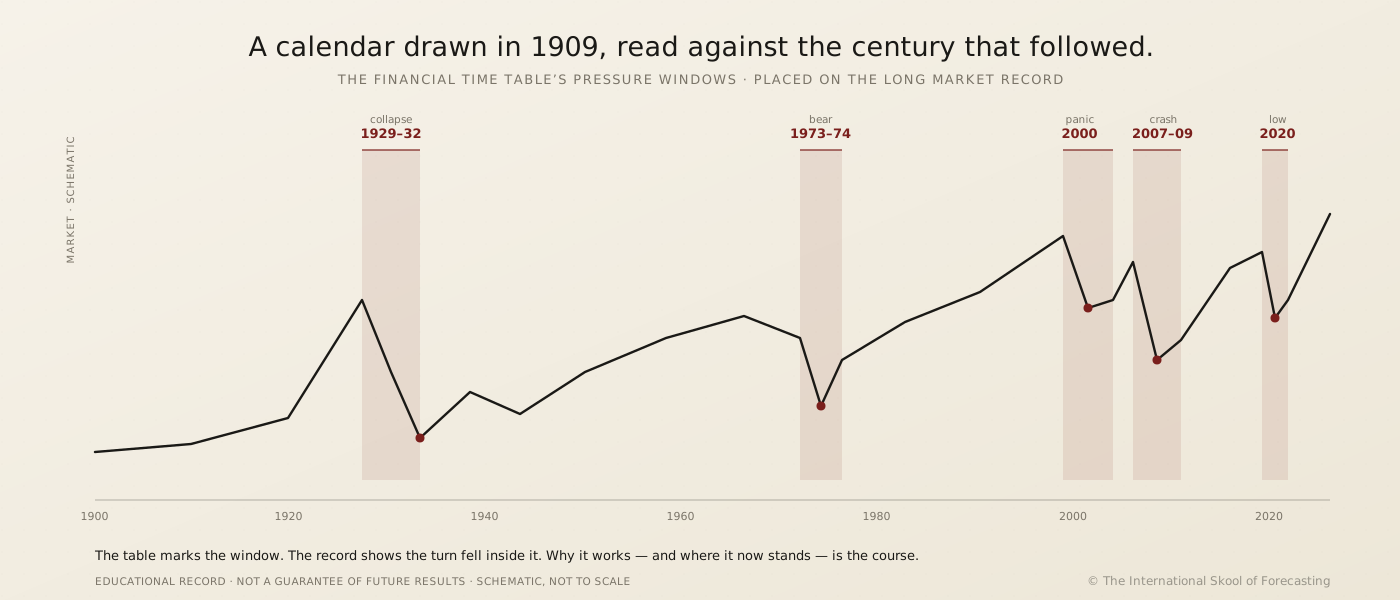
The H phase — peak speculation, most prosperous year — ran through the late 1920s exactly on the table's schedule. The J that follows H carried the crash warning. K brought the unemployment. The Dow fell from 381.17 to 41.22 — 89.2 percent — and did not see 1929 again until 1954. The letters were on the page first; the decade filled them in.
The rebuilt instrument is checked against the October 2008 credit-crisis peak — the point the current course record treats as its own proof. The test is not a promise that every future window will resolve the same way. It is a concrete historical case you can inspect against the source record and reconstruct through the lessons.
Two dates, fifty-five years apart, joined by the word revises. The page itself was built around 1908 — a quarter of a century before the earlier date, eight decades before the later one. A man fixing a typo does not reach forward into 1989 to do it. He is stating the construction rule, once, in the margin, and never again anywhere in print.
H is the good year. High prices, the most money in circulation, everybody confident. What follows H is the phase Gann's legend calls the major panic — four years of falling prices, stagnation, unemployment. That is the printed sequence, and it ran that way into 1837. Into 1873. Into 1929. Into 2008.
The legend says four years. The 1873 contraction ran five and a half — the longest the NBER has ever dated. That gap is the kind of thing you only find by walking the record rather than quoting the legend, and it is why Chapter 3 walks all twelve cycles instead of the famous three.
A live cycle almost never allows only one resolution. Telling the permitted ones apart — instead of picking the one you like and hoping — is most of what this course is. A second pattern runs underneath — the decade rhythm that puts stress on years ending in seven: 1857, 1907, 1987, the 2007 top. It is not clean either. 2017 was one of the quietest years the market has ever printed, and the rhythm has nothing to say about it. Where the two readings agree the case is stronger; where they diverge you have learned something more useful than a date.
I am not asking you to believe that. I am telling you the course teaches you to produce it, check it, and disagree with it if the evidence says so. Chapter 4 covers the honest complication: since 2009, central bank policy has held equities above where the business cycle alone would put them. The table still names the business cycle correctly. The gap between the warning and the event got longer. You need to know that before you use it.
Every chapter ends with something you hold — a constructed spreadsheet, a verified calculation, a projection you can defend. Every chapter also ends with a graded exam, because I want to know you can do it, not that you watched it.
And yes — the engine underneath the columns is astronomical, and Chapter 2 is where you meet it. I would rather you learned that here than felt ambushed by it in the second lesson.
But notice what the method does not ask of you. It does not ask you to believe anything. You look up a published position, you do arithmetic on it, and you check the result against 224 years of price and economic record that you had no hand in choosing. If the arithmetic fails to land, you will watch it fail to land. That is the entire arrangement, and it is why the course teaches construction instead of conclusions.
Gann's original table circulates freely. Partial explanations turn up on forums and in books. What has never circulated is the rule that built the page, the anchor correction, the two cycles sitting inside the same columns, and the 206-year synthesis in Chapter 6. That is the entire value of what you are buying.
The problem with selling that is obvious. A method is not a physical object. Once you have watched Chapter 1 you know where the anchor goes, and you cannot un-know it. If I offered thirty days to think it over, I would be handing the construction rule to anyone willing to spend an afternoon and then ask for their money back. That is not a hypothetical — it is how research like this ends up repackaged and resold under someone else's name.
So the trade is this. You accept that there are no change-of-mind refunds once access is released — this does not limit your rights under the Australian Consumer Law. In exchange, I put everything in — the corrections, the failures, the third of historical cycles that needed adjusting, and the original research I have not published anywhere else. No held-back module. No upsell at the end to get the part that actually works. Access is released as one complete course, so review the offer and terms before you enrol.
I would rather you read this page twice and buy next month than buy today and feel misled. If you want to see the reasoning at full length before deciding, the complete research letter lays out the method, the record and the objections in detail. It costs nothing and it is deliberately long.
What you are agreeing to. Enrolment requires a government-issued photo ID through Stripe and a signed non-disclosure agreement covering redistribution, resale, and public teaching of the method. Verification takes up to 48 hours. If I cannot verify you, you are refunded in full — that is the one and only circumstance in which money moves backwards. No change-of-mind refunds once access is released. This does not limit your rights under the Australian Consumer Law. Once released, access is also permanent: one payment, no renewal, no subscription, and the skill stays yours for every future cycle.
If a sales page only tells you what is strong about a method, it is not a sales page, it is an advertisement. These are the seven questions serious people actually ask, and the answers are the same ones taught inside the lessons.
Not precise enough to trade on its own, and the course says so in the first lesson. There is a measurable margin of error built into Gann's original measurement, and it carries forward. The table tells you which phase of the cycle you are in — that is its job. It narrows 224 years of history down to a two or three-year window. Naming the specific year inside that window takes the other tools in the course. You need both, and anyone who tells you one instrument does everything is selling you something.
Not a matter of opinion — a matter of instruments. Gann measured his anchor from a 1920s almanac that placed the reference point slightly off from where it actually was. Re-run the same measurement on a modern ephemeris, check it against both dates in his own handwritten note, and it lines up cleanly where the almanac did not. The correction is not overriding Gann. It is running Gann's own method with better equipment than he had.
The refinements were locked in against the full backtest before any forecast for the current cycle was published. The widened crash window has to contain seven historical crash events spread across four different cycles — and it does. That is a range holding across independent instances, not one awkward case being accommodated after the fact. Could the coordinates be updated again if better data warrants it? Yes. That is how the method is designed to work, and I would rather tell you that than pretend it is finished.
It depends entirely on whether the correction rule was defined before or after looking at the data. In this method it was defined in advance — a single stated rule about what to do when the trend is still rising on the static date — and then applied to all 224 years before any comparison was made. An adjustment rule applied consistently to every case is a model. An adjustment invented per case is an excuse. Chapter 3 shows you the rule first and the results second, in that order, deliberately.
The test for that is how many free parameters a model has — values you can quietly adjust until the data fits. Here the answer is zero. The cycles are not chosen from a menu; they are the only ones that match the periods Gann stated in writing. The notation levels are fixed by geometry. The lookback band is fixed in advance. When there is no dial you can turn to make it fit, "it explains everything" stops being the criticism it sounds like.
I say exactly that in the capstone lesson. Two windows are not statistically independent in the ordinary sense — they are produced by the same mechanism. What is being tested is not whether two random years happen to rhyme; it is whether the same structural sequence of tops reappears when the same clock resets. It did, in both windows, in the same order. That is worth studying and it is not worth betting the house on, and I would rather hand you that distinction than a number dressed up as certainty.
A spreadsheet, and a free ephemeris you can look up online. No paid data feed, no software licence, no subscription of any kind — not to me, not to anyone. That is the point of teaching construction rather than selling dates: when the course is finished you own an instrument that costs nothing to keep running, and you can rebuild it from scratch in any future decade.
You want a signal service
This course does not send you alerts and never will. It teaches you to build an instrument. If what you want is somebody to tell you what to do on Tuesday, this is the wrong purchase and you will resent it by Chapter 2.
You want trade entry dates
The Financial Time Table works in years, not days. It is a long-cycle economic instrument — it tells you what kind of year you are standing in. If you need precise turn dates for entries, the course you want is Time by Solar Degrees, not this one.
You will not build the spreadsheet
You construct the table alongside the lessons. If you plan to watch the videos with the spreadsheet closed, you will finish with a general impression and no instrument, and the fault will not be the material's.
You need licensed financial advice
I am a researcher, not an adviser. Nothing here is personal advice, nothing accounts for your circumstances, and no part of this course should be treated as a recommendation to buy or sell anything.
There are two kinds of Gann reader. One quotes the table. The other can rebuild it, correct it, and say exactly why the correction is right. The second one never has to ask a forum what a letter means again. Six chapters is the distance between them.
And consider what the first kind is paying. Gann's page named the years and then stopped at 2008. Everything after that is somebody else's interpretation, rented — a subscription that reads the cycle for you and stops the day you stop paying, and that you cannot audit even while you are paying for it. That is the real cost of not owning the construction: not a missed year, a permanent dependency.
So here is the mechanics of it, plainly, with nothing held back for a later upsell:
Enrolment process — After payment, complete a two-minute identity check via Stripe (government ID + selfie) and sign a non-disclosure agreement. Course access is issued after both are reviewed, usually within 48 hours.
Enrol — AUD $897 →One payment · Lifetime access · No change-of-mind refunds once access is released — this does not limit your rights under the Australian Consumer Law
P.S. — If you have skipped down here, this is the whole case in one paragraph. There is a handwritten line in the margin of Gann's Financial Time Table — "25th of December 1989 revises to March 13, 1934" — and it is not the erratum everyone reads it as. It is the construction rule for the entire page, stated once and never repeated in print. This course reconstructs that rule, corrects the anchor Gann measured from a 1920s almanac, and then tests the corrected sequence against 224 years of market and economic record, twelve consecutive cycles, 1784 to 2008 — including the roughly one-third that needed correcting and the one, 1948, that the method got outright wrong and no overlay rescues. AUD $897, once, no renewal, and you walk out holding a table you can carry to 2064 and past it without paying anyone again. The reason to decide now rather than later is not a deadline: it is that the instrument is only useful when you are holding it before the phase you want to read, and nobody has ever built one in a hurry. AUD $897 — enrol here →
P.P.S. — The part most people underestimate is Chapter 5. The 20-year cycle Gann named but never explained. He put a length on it — 240 months — and stopped. Readers have been arguing about what drives it for the best part of eighty years. It has a specific, checkable answer, and once you have it the buy and sell rules follow directly from the geometry rather than from anybody's opinion. That chapter alone is worth the enrolment.
P.P.P.S. — On the terms: I know a no-refund-after-release policy costs me buyers. I have decided I would rather lose those sales than hold back material to protect myself, or water the course down so that a refund window is survivable. You get the corrections, the failure cases, the third of cycles that needed adjusting, and the research I have not published anywhere. If that trade does not appeal, please do not enrol — and if you are undecided, read the full research letter first. It is free, it is long, and it will tell you either way.