Building a Yearly Forecast · Six modules · Nineteen lessons

Build the annual forecast yourself — then grade and revise it as the year unfolds. Gann published several curves in 1928. This course teaches the workflow behind building yours.

In the course, I put Gann's 23 November 1928 document on screen and read it out loud. It contains separate curves for different groups of stocks, built from different cycles and published together. You learn how to build a dated annual research roadmap from the same kind of layered evidence.

The course states the unresolved inversion problem before you enrol. You then learn the workflow for building, checking, and revising your own forecast. Six modules, nineteen lessons. You build the lookback ladder yourself — twenty-two windows, three years back to a hundred and forty-four — then the Mass Pressure Chart that resolves the whole stack into a curve, in your own spreadsheet, on your own data.

Before you build your own forecast, you watch me grade my 2024 forecast on camera, including where my conviction was weak when I made it. I also state the limit plainly: the method does not identify exactly when conditions change. The course does not claim to solve that timing problem. In the final module you watch the complete 2025 build across eight lessons: seven cycles, resolved into three forecast curves for the year.

I publish no dated forecast on this page. The product is the workflow: you build the forecast, check it against the record, and revise it as new information arrives.

One payment · Lifetime access · Identity check and NDA required before release · No change-of-mind refunds once access is released — this does not limit your rights under the Australian Consumer Law

6 modules Nineteen lessons · 70% pass threshold on every exam
3–144 years Twenty-two lookback windows every theme has to survive
2024, graded My last annual forecast, reviewed on camera — misses included
Falsifiable Closed calls carry numbers that can prove them wrong
Every December You sit down and build next year's, yourself
§ The record · What the method has actually produced

No student testimonials yet. In their place: a forecast I graded myself, in public, misses included.

You are already thinking it: no testimonials, and the proof is the man marking his own homework. Fair. So here is the arrangement — every case below is closed, dated, and checkable by you without my help. The first is the post-mortem you watch before you build anything. The second is a historical illustration across a cycle that finished decades ago. The third is the complete build, eight lessons, start to finish. Evidence the method deserves study. Not a guarantee of what next year holds, and I will not pretend otherwise anywhere on this page.

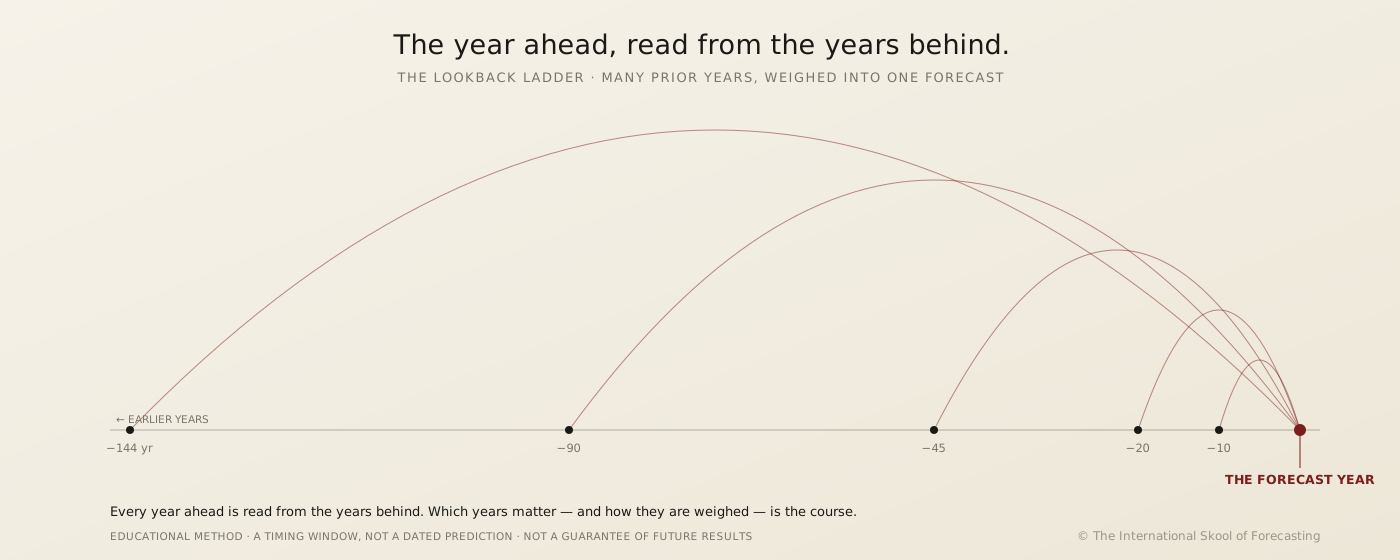
A schematic of the lookback method: several prior years, set at different distances back, arc forward and converge on a single forecast year.
Many prior years, weighed into one forecast. The method is the convergence; which years matter, and how they are weighed, is the course.

My 2024 forecast, graded in Module 5: "I don't have any clear conviction of a specific event playing out... which is odd because usually I've been just drawn straight out with some pretty far-fetched calls." That is the forecaster grading his own conviction on camera, not after the fact — and it is the lesson you watch before you build anything.

2024
The honest post-mortem, watched before you build your own

A historical illustration of the method, not a live forecast: read backwards over a closed cycle, the decade-cycle rhythm and the financial timetable pointed to high prices late in the 1990s, then a panic window into 2000. The market crashed into 2000 and bottomed in 2002. Nobody at this school published that at the time — it is worked in the course as a teaching case, on data anyone can pull. It shows how the layered reading behaves across a real, closed cycle — why the method deserves study.

2000
A historical illustration of the decade-cycle rhythm

Eight lessons. Twenty-two lookback windows worked one at a time, then the swing-cluster scan, then the synthesis — where seven cycles that disagree with each other get resolved, on camera, into three forecast curves. Three. Not one. The same plural answer the 1928 document gave, arrived at in front of you, then handed to you to do yourself.

2025
The complete forecast, built on camera in the final module
§ Why now · The method's main limitation

The method can identify the year's structure, but it cannot tell you exactly when conditions will change.

In Module 5 I say it on camera, plainly: "my understanding right now is that it's impossible to know when the year is going to invert, and that would be a lack of education or lack of understanding on the topic from my part." I've not met one forecaster who claims to have solved it, and I've not read one book or course on it either. If a course tells you it has cracked inversion timing, that is the moment to stop trusting the course, not start.

What the workflow gives you instead is a discipline for not pretending the January 1 forecast is the finished product. The roadmap gets checked and, where the evidence says so, rebuilt at three scheduled dates every year — the calendar realignment points built into the workflow: 22 March, 22 June, 21 September. Doing the method right does not mean being right on day one. It means knowing when to throw the reading away and rebuild it.

There is a second admission in that module, and it costs me more than the first. The Australian market is the one I am asked about most often, and it is the one this workflow handles worst. Not because the cycles fail — because the local price record does not reach back far enough to run the long windows against it at all. I worked it live on camera anyway. I found a six-year and a seven-year rhythm that fit, and then I said, in the same breath, that they invert almost every year or two and that I do not have the answer for that. Some markets are less forecastable with this method than others right now. That belongs in the paid lesson, out loud, not in a footnote.

So why publish either of those on a $9,997 page? Because of what sits next to them. In the same 2024 build I wrote down, in advance, the numbers that would disqualify my own cycle work: "I would say that this cycle is probably invalid if Bitcoin at the end of the year is $50,000 or Bitcoin at the end of the year is $24,000." That is not a prediction. It is a pre-set test that could invalidate the model. 2024 has closed. The closing number is public. You can check it yourself in about thirty seconds, without asking me anything. That is the same standard the course teaches.

Modules Six
Lessons Nineteen
Lookback ladder 3–144 years
Scheduled realignment 22 Mar · 22 Jun · 21 Sep
Known open problem Timing the inversion — addressed, not solved
§ The offer · What you build · What you pay

Six modules. Nineteen lessons. Six graded exams. One year-ahead roadmap you built with your own hands.

Every module ends with something you hold — a research file, a constructed spreadsheet, a cycle reading walked against the record. Every module also ends with a graded exam at a 70% pass threshold, because I want to know you can do it, not that you watched it.

  • Module 1 · Decade-Analog Research (3 lessons). You build the event-cluster database, working the lookback ladder from 2019 back to 1904. You learn the subtraction discipline first, and it is a counting rule, not a judgement call — the three-hit rule. One appearance is noise. Two is coincidence. Three across non-adjacent lookback windows is a working signal, and nothing below three earns a line in the forecast.
  • Module 2 · Decade Cycle Foundations (2 lessons). Gann's ten-year roadmap — the pattern Gann himself called his greatest discovery, and the one my mentor Frank first walked me through — plus the 18.6-year Financial Time Table as a second witness layered on top. (The Financial Time Table gets its own full six-module deep dive in my standalone Gann Financial Time Table course; here it is one lesson, used as one input among several.)
  • Module 3 · Mass Pressure Analysis (4 lessons). The forecast curve itself. This is the module where the 23 November 1928 document comes up on screen and I read it out, including the part almost nobody notices — Gann running several curves at once rather than one. Then you build yours: gather the decade-cycle highs and lows, construct the mass-pressure curve, and layer solar-degree counts, seasonal dates, and 144/288-day anniversary counts to find where the windows cluster. When your curve and the market disagree, you learn the working rule — ask which cycle is wrong, then remove it or invert it. That, not the drawing, is the skill.
  • Module 4 · Locating Tops & Bottoms in Cycles (1 lesson). Where the cycle clusters meet the curve — and how to tell a genuine structural turn from noise in the data.
  • Module 5 · 2024 Forecast Review — Lessons Learned (1 lesson). Not a highlight reel. I walk back through my actual 2024 forecast build on camera and grade it in public — what the lookback ladder got right, what it flagged that never showed up, and the plain admission that timing an inversion in advance is not currently solved. You watch this before you build your own.
  • Module 6 · The 2025 Forecast — A Complete Build, Watched Start to Finish (8 lessons). My complete 2025 forecast, constructed on camera: twenty-two lookback windows worked one at a time, the theme clustering, the swing-cluster scan that projects the 144- and 288-day counts forward, and then the synthesis lesson where seven cycles that flatly contradict each other resolve into three forecast curves — plural, the way the 1928 document did it. A closed case you can check against what actually happened, including how the workflow adapts along the way to gold, cryptocurrency, and the Australian market.
Three hours of private consultation with Jonathan Evans, at $450/hr — roughly what it takes to walk one annual build by hand $1,350
Ten Decembers of a comparable annual-forecast letter instead. The cheapest I can find in this category publishes at about $700 a year; the serious end of it runs to about $2,000 $7,000–$20,000
The Forecast Roadmap spreadsheet and lookback-ladder toolkit — I have never sold it separately, so I am not going to invent a price for it here Included
What ten Decembers of the equivalent costs elsewhere $8,350–$21,350
You pay once. Nothing renews. The workflow keeps working after I stop selling it. AUD $9,997
Enrolment
AUD $9,997
One payment · Lifetime access

  • Six modules · Nineteen lessons · Graded exams
  • The lookback ladder — twenty-two windows, 3 through 144 years
  • The Mass Pressure Chart, built in your own spreadsheet
  • My 2024 forecast, graded on camera — misses included
  • My complete 2025 forecast, built start to finish across the final module — a closed case
  • Every scheduled realignment date, and why it matters
  • Lifetime access after verification
Enrol — AUD $9,997
Identity check and NDA required before access is released. No change-of-mind refunds once access is released — this does not limit your rights under the Australian Consumer Law.
§ Read this before you buy · The terms are unusual and I want them understood

Once access is released, there are no change-of-mind refunds. Here is exactly why — and what that trade buys you.

Gann's published forecasts and books circulate freely. Partial explanations of pieces of his methodology turn up in dozens of Gann-tradition books. What has never circulated is the full workflow — the lookback ladder across every window from three to a hundred and forty-four years, the theme-clustering discipline, the Mass Pressure Chart construction, and the honest 2024 grading session that shows you exactly where the method still has an open problem. That is the entire value of what you are buying.

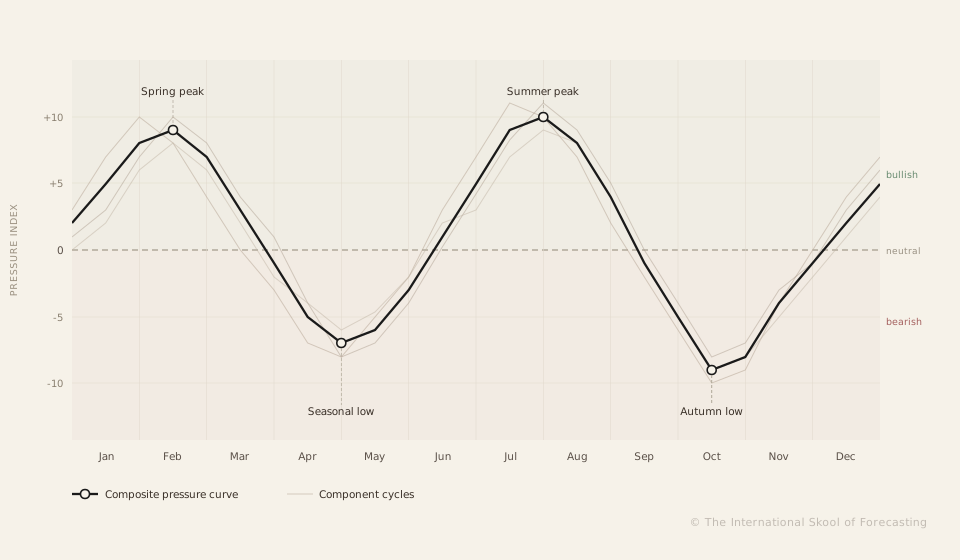
Example Mass Pressure Chart: several component cycle lines overlaid against a composite pressure curve, plotted month by month with bullish, neutral and bearish zones and marked turning points.
Component cycles overlaid → composite pressure curve → marked turning points → bullish/neutral/bearish zones

The problem with selling that openly is obvious. A workflow is not a physical object. Once you have watched Module 1 you know how the lookback ladder is built, and you cannot un-know it. If I offered thirty days to think it over, I would be handing the workflow to anyone willing to spend a few weekends and then ask for their money back.

So the trade is this. You accept that once access is released there is no change-of-mind refund. In exchange, I put everything in — the successes, the honest misses in the 2024 review, the admission that the Australian market defeats the long windows for want of data, and the full workflow I have not published anywhere else. No held-back module. No upsell at the end to get the part that actually works. Review the offer and terms before you enrol; access is released as one complete course.

I would rather you read this page twice and buy next month than buy today and feel misled. If you want to see the reasoning at full length before deciding, the complete research letter lays out the method, the record and the objections in detail. It costs nothing and it is deliberately long.

What you are agreeing to. Enrolment requires a government-issued photo ID through Stripe and a signed non-disclosure agreement covering redistribution, resale, and public teaching of the method. A person reviews each submission by hand. If verification cannot be approved, no access is released and we work with you directly to resolve it. No change-of-mind refunds once access is released. This does not limit your rights under the Australian Consumer Law. Once released, access is also permanent: one payment, no renewal, no subscription — you keep the workflow for every future December.

§ The objections · Asked and answered before you spend a dollar

Seven fair criticisms of this course. I raise most of them myself in Module 5. Here they are up front.

If a sales page only tells you what is strong about a course, it is not a sales page, it is an advertisement. These are the questions serious buyers actually ask, and the answers are the same ones taught inside the lessons.

"You just told me nobody knows exactly when conditions will change. Why would I pay $9,997 for a method that admits that?"

Because the alternative is a course that pretends to have solved it, and none of them have. What you are paying for is not a guaranteed inversion timer — nobody sells you a real one, whatever the marketing says. You are paying for the discipline that makes the gap survivable: a scheduled review at three fixed calendar points every year, a workflow for judging your own forecast honestly instead of quietly forgetting the parts that missed, and the actual on-camera example of me doing exactly that with my own 2024 build. That is worth more than a false promise of precision.

"What actually happened with your 2024 forecast — and can I see it graded, or is that just marketing language?"

You can see it, in full, in Module 5. I walk back through every layer of the 2024 build — the decade themes, the lookback clusters, the cycle work — and grade each one on what it produced. I say on camera that I had lower conviction going into 2024 than in prior years, and I name the diagnostic themes the lookback surfaced without dressing them up as a confident call. This page does not lead with a "the forecast called it" claim, because I would rather you hear the honest version from the actual lesson than a polished one from a sales page.

"How is this different from your $897 Financial Time Table course?"

The Financial Time Table course is a deep dive on one 18.6-year economic cycle — its construction, its correction, its 224-year backtest. This course is the full annual workflow: the lookback ladder, the decade cycle, the Mass Pressure Chart, and the synthesis lesson where seven cycles that flatly contradict each other get resolved into three forecast curves for a specific year. The Financial Time Table is one lesson inside this course, used as a single input. If you want the FTT cycle in exhaustive depth, take that course first or alongside this one — they are built to work together, not to duplicate each other.

"Gann's books are public domain. What am I actually paying for that isn't already free?"

The books give you fragments — a chapter here on the decade cycle, a paragraph there on a twenty-year rhythm. Nowhere in Gann's own writing, and nowhere in the Gann-tradition books I have read, is the full workflow laid out: which lookback windows to run, how to cluster themes without kidding yourself, how to build the Mass Pressure Chart, and how to synthesise the layers into one dated roadmap. That synthesis is what took years to assemble, and it is what this course teaches — not the source material, which was never hidden.

"Do you name a specific market call anywhere on this page?"

No, deliberately. The 2000 case is a closed historical illustration — what the method produced then, checked against what actually happened, decades after the fact. The 2024 case is a graded post-mortem of a forecast I already published and already know the outcome of. Neither is a forward call, and I am not going to publish one here or anywhere else on this site. What you are buying is the ability to build your own reading and argue with it — not a prediction to trust on my word.

"I'm not confident building a spreadsheet model from scratch. Is this still for me?"

You build the Forecast Roadmap spreadsheet alongside the lessons, step by step, starting from a simple structure in Module 3. You do not need to be a spreadsheet expert going in — you need to be willing to sit with the tool while it is being built on screen and replicate each step. If you plan to watch passively with the spreadsheet closed, you will finish with a general impression and no working roadmap, and that outcome is on the approach, not the material.

"What software or data do I actually need to follow along?"

A spreadsheet, a free ephemeris, and access to publicly available historical market and news records — Wikipedia's year-in-review pages are the starting index for the theme research, not a paid archive. On screen I build the Mass Pressure Chart in Optuma, a paid charting platform, because it calculates a correlation reading for you; the lessons also show the manual spreadsheet route, which works but leaves you eyeballing the correlation by hand instead of reading it off the tool. Optuma is not required to complete the course, but it is the version of the workflow I actually use and recommend if you can budget for it. Beyond that: no other proprietary software, no paid data feed, no subscription of any kind.

§ Do not enrol if

Four kinds of reader should keep their money. I would rather lose the sale than the correspondence.

You want a finished forecast delivered to your inbox

This course does not send you a finished annual report and never will. It teaches you the workflow to build your own. If what you want is somebody else's roadmap arriving every December, this is the wrong purchase — a subscription service is what you're looking for, not a course.

You want a solved inversion timer

Module 5 says it plainly on camera: nobody, including the instructor, currently knows how to time a mid-year inversion in advance. This course teaches scheduled realignment as the honest fix. If you are looking for a method that claims to have solved that problem, you will not find it here, and you should be suspicious of anyone who claims they have.

You will not do weeks of research per forecast

The lookback ladder alone — three to a hundred and forty-four years back, theme by theme — takes real time. Building the Mass Pressure Chart takes real time. If you plan to watch the lessons without doing the work, you finish with theory and no roadmap, and the fault will not be the material's.

You need licensed financial advice

I am a researcher, not an adviser. Nothing here is personal advice, nothing accounts for your circumstances, and no part of this course should be treated as a recommendation to buy or sell anything.

§ The decision

Own the workflow, not somebody else's roadmap. Including mine.

There is a line in this field between the researcher who reads the forecast and the researcher who writes one. It is not a line of intelligence. The person who writes it has worked twenty-two lookback windows by hand and knows exactly which of them he trusts and why. Six modules is the whole distance between those two people.

Then there is the arithmetic of staying where you are, and I am going to run it against myself. Annual forecast letters in this field publish at roughly $700 to $2,000 a year. Take the cheapest one I can find. Ten more Decembers of subscribing to it costs about $7,000 — call it three thousand dollars less than this course. I am not going to pretend otherwise. So here is what the three thousand buys: at the end of those ten years the subscriber holds ten documents he cannot verify, cannot extend, and cannot turn on a market the author never covers. You hold ten dated roadmaps in your own files, each one built by you, each one graded by you — and the eleventh costs you nothing. At the serious end of that range you would have spent twice this course's price over the same ten years and still own none of it.

And here, plainly, is what the $9,997 actually buys.

  • Six modules, nineteen lessons, worked on screen throughout
  • The lookback ladder — twenty-two windows, three through a hundred and forty-four years
  • The Mass Pressure Chart, built in your own spreadsheet
  • My 2024 forecast, graded on camera — verified by you, not asserted by me
  • My complete 2025 forecast, built start to finish across the final module — a closed case
  • A workflow you repeat every December without ever paying anyone again
AUD $9,997
One payment · Lifetime access

Enrolment process — After payment, complete a two-minute identity check via Stripe (government ID + selfie) and sign a non-disclosure agreement. Course access is issued after both are reviewed by a person, usually within 48 hours.

Enrol — AUD $9,997

One payment · Lifetime access · No change-of-mind refunds once access is released — this does not limit your rights under the Australian Consumer Law

P.S. — If you skipped the page and landed here, this is the part that matters. In the 2024 build, before the year ran, I wrote down the numbers that would disqualify my own cycle work: "I would say that this cycle is probably invalid if Bitcoin at the end of the year is $50,000 or Bitcoin at the end of the year is $24,000." Not a prediction — a threshold, published in advance, inside a paid lesson, handing the student the tool to throw my model out. 2024 has closed and the closing number is public, so you can settle that one yourself in thirty seconds without taking my word for anything. That is the standard the whole course runs on: six modules, nineteen lessons, twenty-two lookback windows worked by hand, the Mass Pressure Chart built in your own spreadsheet, and my 2024 forecast graded on camera — including the plain admission that timing a mid-year inversion is not solved by me or anyone I have read — before you build a single cell of your own. AUD $9,997, one payment, lifetime access. No change-of-mind refunds once access is released. This does not limit your rights under the Australian Consumer Law. As for why now rather than next year: the roadmap you build covers the year after you build it. Every December you skip is another twelve months spent inside somebody else's reading instead of your own.

P.P.S. — On the terms: I know that having no change-of-mind window costs me buyers. I have decided I would rather lose those sales than hold back material to protect myself, or soften the 2024 review so a refund window is survivable. You get the full lookback ladder, the honest grading, and the workflow I have not published anywhere else. If that trade does not appeal, please do not enrol — and if you are undecided, read the full research letter first. It is free, it is long, and it will tell you either way.