Get the finished year-ahead research map before the year begins.
The Forecaster is a 12-month applied-research desk. You receive the Annual Roadmap across six markets, the Master Pivot Calendar, twelve monthly briefings, and members forum access. The 2020 warning below is one documented case — evidence to inspect, not a promise about the next year.
In November 2019 the Dow had just set a record high, and nobody had heard of the virus. The forecast named a March low anyway.
The Dow bottomed on 23 March 2020 at 18,591.93.
How?
Not instinct. Not a macro call. And to be plain about it: nobody at this desk knew a pandemic was coming. The forecast never named a cause. It named a window — built by stacking several independent long cycles against the historical record until they agreed on the same narrow stretch of calendar. The virus arrived inside it. That cycle stack is what produced every case in the archive below, and it is what a membership buys.
Six years published in advance across a seven-year span. Each one documented before it began.
The Pandemic Crash Warning.
Issued November 2019. Identified the February peak and the March crash window four months before the event. The DJI fell 37%, peak close to trough close.
Read the record → 2022 · The HarmonicThe Gold Target: $1,621.
Stated the downside target before the move. Gold bottomed in the $1,620s, near the call.
Read the record → 2023 · The ContrarianThe Recession That Never Came.
While economists called a crash, we identified the March bottom and the start of a 24% S&P bull run.
Read the record → 2024 · The FrequencyFourier vs. The Halving.
Fourier-cycle work challenged the simple halving narrative. Bitcoin chopped through the first half, then launched in Q4.
Read the record → 2025 · The TransitGold, and a claim I am not going to make.
A date was set in advance and gold rose after it — but gold set records almost continuously through 2025, so that is not evidence and I do not present it as any. The record shows the date held.
Read the record → 2026 · The StressThe 2026 Stress Window.
Published before the year began: a fracture-risk reading across a specific bloc of nations. The year is still running, so this one counts as published, not as a result.
Live thesis →Building this research across six markets takes more time than most investors have.
You already read the market closely. You follow the macro. You know your charts. None of that is the problem.
The problem is the calendar. A real year-ahead map is not one cycle and one chart. It is the decade rhythm, the 18.6-year node tide, the long planetary cycles, and the historical analogues — four separate bodies of research, walked against the record and laid one on top of another until you can see where they agree. The desk calls that the cycle stack. It is the whole method in two words, and it explains every case further down this page.
Each layer takes its own research. Each has to be weighed against the others. Then the whole thing has to be rebuilt as the year moves and the tape argues back. That build takes weeks. It takes a working method most people never assemble, and a discipline almost nobody sustains across twelve months while also having a life and a portfolio to run.
So the serious investor does what looks reasonable. They pick one cycle they trust and lean on it. Or they read the macro commentary and time the rest by feel. Both fail in the same place. One cycle is a line, not a stack — it misses every spot where the other layers contradict it. And feel is not a map. It is a reaction.
Then there is the other source most investors fall back on: the commentary itself.
Commentary usually explains the move after it happens.
Watch the cycle. The market turns. The price moves. The headlines explain the move a week later. The think pieces explain it a month later. By the time the explanation is clean and confident, the turn is already behind you and the next one is already forming with no one watching.
This is not a flaw in the writers. It is the shape of the work. Commentary is reactive by design. It describes what price did and reasons backward to a cause. That is useful for understanding. It is useless for positioning. You cannot stand in front of a turn you only learn about after it has passed.
In February 2020 the commentary was bullish. Markets were roaring. A crash felt impossible. The stack had said otherwise since the previous November, in writing, to members. That gap — between what the cycles flagged in advance and what the commentary explained in arrears — is the whole reason this desk exists.
The Forecaster closes that gap. It is not a course. It does not teach you to build the map yourself. It hands you the finished map, built by the desk, kept current for twelve months. You enter the year with the year already drawn.
The LineageThe desk uses long-cycle methods documented before modern markets.
That is not a boast about age. It is the reason the method still reads a year none of these men lived to see.
W.D. Gann built his annual stock forecasts from cycles he spent forty years cataloguing. Louise McWhirter documented an 18.6-year relationship between the business cycle and credit conditions in 1938. Samuel Benner mapped prosperity and panic on a long rhythm in 1875. Sepharial applied planetary geometry to price in the early 1900s. None of them were guessing. They were reading a pattern that existed before they found it.
What The International Skool of Forecasting does is run that same work forward. The source material is primary. The tools are theirs. The application is current. The desk reads the same long cycles those researchers read, against the same historical record, and writes the result into a map for the year ahead.
That lineage matters for one practical reason. These cycles operate on horizons no trading desk competes for. A quant model trades milliseconds to days. None of them holds a position across the 18.6-year node tide or the long planetary cycles. The edge is not speed. It is time-scale. The desk works on a layer the fast money never touches, which is the same layer the old forecasters worked, and the reason their method still reads the year.
The 2020 warning came from three independent research layers.
Most desks study price after it moves. This one studies time before the move is obvious, and 2020 is the cleanest example of what that distinction actually buys you.
Here is the 2020 stack, layer by layer. The decade cycle — years ending in zero carry a specific historical shape. The 18.6-year node tide, which sat in its correction phase. The mass pressure work, synthesising several independent cycles, which pointed to the same narrow period. Three layers, three separate literatures, one narrow window. Published November 2019.
That is the method, at the level a member needs to trust it. It does not tell you what will happen. It identifies when the conditions exist for something to happen. The distinction matters. It is the line between a map and a promise. A map shows you the terrain and the pressure points. It does not walk the road for you, and it does not guarantee what waits at the turn. Every call in the archive rests on that distinction, and so does every boundary in this letter.
You do not need to learn how the map is drawn to use it. That is the point of a desk. The cartographer surveys the ground. You read the chart and plan the route. If you want to learn to draw the map yourself, that is a different path, and it has its own page. This one sells the finished map.
The record includes a gap.
You are about to read eight documented cases, and they are drawn from five closed years: 2020, 2022, 2023, 2024 and 2025. The archive above adds 2026, which is still running. I count that one as published, not as a result, and you should too.
Now look at what is missing. There is no 2021 in this archive. Six years published across a seven-year span, and the gap sits in the middle of the strongest run. I am not going to dress that up or bury it in small type at the bottom of the page. A desk that shows you an unbroken wall of wins is showing you a curated wall, and you would be right to distrust it.
Which raises the objection you have probably already formed: anyone can find a cycle that fits after the event. Correct. Hindsight cycle work is worthless, and the industry is full of it. That is why every case below carries a publication date that precedes the year it describes. The claim goes on paper first. The outcome is checkable second. I would rather leave a visible gap in the record than fill it with anything reconstructed afterwards.
So do not take my word for the dates. Every case links to the forecast page it came from. Open one and read its publication note before you read a single word of the forecast itself — that is the only part of this page you actually need to audit.
The record, case by case.
Seven documented cases across five closed years. Each was published before the year it covered. Read them as evidence the desk's work deserves study — not as a promise that the next window behaves the same way. The boundary beside each case is part of the case.
Issued November 2019, four months ahead of the event, the forecast put a low in March. The Dow bottomed on 23 March 2020 at 18,591.93 — 37% below the 29,551.42 close it set on 12 February, measured close to close, which is the basis every drawdown figure on this page uses. It also described the recovery path that followed into August. Three layers of the stack pointed to the same narrow window, and the window held.
The boundary: this does not prove certainty. It shows why the timing method deserves study. The forecast did not name the cause and did not name the day. It named the window. The cause arrived inside it.
The 2022 gold forecast set a target near $1,621, stated in advance. Gold’s low that year came in around that level — the lowest close was about $1,622, and intraday prints vary by feed, so I quote the range rather than a decimal. The market traded into the zone. Note what this case tests: the stack sets the when, and price geometry sets the where. This is the second half of the method, checked on its own.
The boundary: one target landing close is evidence the geometry deserves study, not proof the next target will land the same way. The desk does not claim a perfect record and does not sell one.
The forecast called the worst year for stocks since 2008, with a Q1 peak and an October low. The S&P 500 fell 19.4%. The Nasdaq fell 33%. The shape of the year was mapped before the year began.
The boundary: a mapped year is not a year without risk. The map told you where the pressure sat. It did not remove the drawdown or guarantee the timing of every leg inside it.
The forecast flagged a long-cycle geopolitical stress reading pointing to Taiwan as a flashpoint. In August, the Pelosi visit was followed by China's largest-ever military exercises around Taiwan. The cycle pointed to stress in the region before the event.
The boundary: the cycle flagged a flashpoint, not a war and not a specific event. A flagged window is a region of pressure on the calendar. What fills it is never guaranteed.
The forecast called recovery against the recession consensus. While economists looked for a crash, the cycle work identified the March bottom and the bull run that followed. The S&P 500 rose 24%. The Nasdaq rose 43%.
The boundary: being early against the consensus once is not proof the method is always right and the consensus always wrong. It is one documented case where the layered reading and the crowd disagreed, and the record sits where anyone can audit it.
Fourier work is one more layer of the same stack — it pulls the repeating frequencies out of the price record itself instead of reading them off a calendar. Here it challenged the simple halving narrative. Bitcoin chopped through the first half of the year, then launched in Q4 — closer to the shape the cycle work described than the shape the popular halving story expected.
The boundary: challenging a popular narrative and being closer to right is evidence, not a signal. The work did not name a price and did not name a day.
A date was set in advance and gold rose after it — but gold set records almost continuously through 2025, so that is not evidence and I do not present it as any. The transit was on the calendar before the move, and the record shows the window deserved study.
The boundary: a transit is a window, not a guarantee and not an exact gold signal. The desk reads the window, then tests it against live structure. So should you.
The annual roadmap is completed before the year starts.
The 2020 stack was built in November 2019, when a crash still felt impossible. That is the only moment a year-ahead map can honestly be built.
So the same layers are stacked every year. The decade rhythm. The 18.6-year node tide. The long planetary cycles. The historical analogues. Walked against the record exactly as they were for 2020, 2022, 2023, 2024 and 2025, then synthesised into a single roadmap.
This is not a prediction. It is a map. Markets can and do invert. The work is to map the pressure windows, then test each one against live structure as the year unfolds.
The current Annual Roadmap marks the pressure windows the cycles flag, each documented with the basis behind it. Members enter the year with that map in hand — before the commentary writes its first explanation. That is the difference between standing in front of a turn and reading about it after.
What a member receives.
Four deliverables, across twelve months. Not a feature list — four jobs the desk does so you are not doing them alone.
-
I.
The Annual Roadmap
The full-year directional map across six markets — the ASX 200 (XJO), the Dow, the Nasdaq, the S&P 500, Bitcoin, and gold — published before the year begins. It lets you start January with the whole year already drawn instead of a blank page, so every position you take sits inside a frame rather than reacting to the last headline.
-
II.
The Master Pivot Calendar
The month-by-month timing windows where the cycles flag a likely change in direction, each with its probability context. It lets you know which weeks to watch before they arrive, so you are tightening your stops and sizing your risk into a flagged window rather than discovering the turn after price has already made it.
-
III.
Twelve Monthly Briefings
One briefing each month that updates the map as the year develops, and corrects the roadmap when the tape argues back. It lets you keep a living year-ahead view without doing the rebuild yourself, so the map in your hands in June reflects what the market actually did in the first half, not what was guessed in December.
-
IV.
The Members Forum
A private room to discuss the live roadmap with the desk and the other members as the year unfolds. It lets you ask how a window applies to your market, see how other serious people are reading the same pressure, and pressure-test your own thinking against a small, qualified group rather than a public crowd.
What you receive during the 12-month membership.
The deliverables are not four files in a folder. They are a rhythm. Here is how the year runs.
January. The Annual Roadmap is already in your hands. You sit down with the year drawn — six markets, the directional bias for each, the pressure windows marked on the calendar. You plan your year against a map, not a feeling. The blank page that ruins most January planning is gone before the month starts.
February through the spring. The monthly briefings begin. Each one reads the tape against the roadmap. Where the market is tracking the map, the briefing says so and holds the line. Where the market is arguing back, the briefing says that too and adjusts. You are not left holding a December guess in April. You are holding a map that has been kept current.
Into each pivot window. The Master Pivot Calendar told you these weeks were coming. As one approaches, you already know to watch it. You tighten risk into the window. You size your positions for a possible turn. Whether the turn comes or the window passes quietly, you met it prepared, in front of it, not behind it. That is the whole purpose of timing context — to convert a date on a calendar into a decision you made early.
All year, in the forum. When a window does not behave the way you expected, you ask. When you want to know how the roadmap reads against a market the desk did not cover, you ask. When another member sees the same pressure from a different angle, you read it. The forum keeps the map alive between briefings and keeps you inside a serious conversation rather than a noisy one.
December. The year closes. You have spent twelve months in front of the calendar instead of behind it. The next year's roadmap arrives, and the rhythm begins again.
Which is where the arithmetic objection arrives, and it should. Fourteen hundred dollars for a map I still have to interpret myself. Fair. So here is the comparison I would want if I were sitting where you are. It is not $1,397 against a trading profit — nobody can honestly promise you that, and this page does not try. It is $1,397 against the weeks of research it takes to build the same map yourself every December, and the rebuild every month after that. Roughly $116 a month for the one job on your list you have quietly accepted you are never going to get to. If it still reads as expensive after that, then it is expensive for you, and you should not join.
What this is not.
This is not a signal service. No alerts. No “buy now” or “sell here.” The roadmap gives you the frame. You make the decisions inside it.
This is not a mechanical trading system. No algorithm produces your entries. The desk does the cycle research and the synthesis. The judgement at the moment of the trade stays yours.
This is not financial advice. The desk publishes research. It does not know your account, your risk tolerance, or your obligations, and it does not recommend any position. If you need licensed guidance for a decision, take it to a qualified adviser.
No forecast guarantees a result. The cycles identify conditions. Markets have inverted before and will again. What the desk provides is a body of research — Gann, McWhirter, Benner, Sepharial — applied to current markets, documented in real time, and kept current for twelve months. The strongest members treat it as a discipline, not a data feed. They read the map, test it against live structure, and own the call.
Say it plainly, because trust depends on it: the method identifies timing conditions. It does not remove risk. You still have to study, test, and judge. A member who wants the map to think for them will be disappointed. A member who wants the map to sharpen their own thinking is in the right room.
Who this is for.
This desk is built for a specific kind of investor. Both of us do better if you decide honestly whether that is you.
It is for the investor who already manages real capital and wants a year-ahead frame they cannot reasonably build alone. You read the market well. You do not have weeks each December to walk the cycle stack and rebuild the map every month. The desk does that work and hands you the result.
It is for the investor who wants to understand timing, not just react to price. You are tired of learning about the turn after it has happened. You want to meet the window prepared. The Pivot Calendar and the monthly briefings are built for exactly that habit.
It is for the student of market history who respects primary sources. You take Gann, McWhirter, Benner, and Sepharial seriously as researchers, not as decoration. You want a living application of that tradition, kept current against today's markets, not a book of old quotes.
It is for the investor who can hold probability and uncertainty at the same time. You understand that a flagged window is a region of pressure, not a promise. You can act on a strong reading while accepting that markets invert. That temperament is the single best predictor of who gets value here.
Who this is not for.
You want buy and sell alerts
There are none. If you want a screen that tells you when to click, this is the wrong desk and you would resent paying for it.
You are not willing to study the material
The roadmap rewards a reader who works with it. It is wasted on someone who files it and forgets it.
You need certainty before you act
The method gives probability and timing context. It does not eliminate risk and it never will. If a downturn inside a flagged window would feel like a broken promise to you, do not join.
You want a quick trading hack
This is slow, serious work on a long horizon. The value compounds across years, not across a weekend.
Why the desk is capped at 72, and why enrolment opens once a year.
Seventy-two is exactly the sort of number a marketer invents, and you should treat it that way until someone shows you the working. Here is the working. Three reasons, and every one of them costs this desk money.
The first reason is the research itself. A year-ahead roadmap holds its value when a small group reads it. Spread the same advance reading across thousands of accounts and the edge thins, the windows get crowded, and the work that took weeks to build becomes background noise. Specialist research is worth more in a room of seventy-two serious people than in a stadium. The number protects what the member is paying for.
The second reason is the forum. A private room of seventy-two qualified people is a conversation. The same room at ten times the size is a feed. The quality of the discussion — the reason the forum is a deliverable and not an afterthought — depends on keeping the group small enough that members recognise each other and the desk can answer real questions.
The third reason is the desk's own capacity. The briefings are written by hand each month. The questions are answered by a person. There is a real ceiling on how many members one desk can serve well, and seventy-two is an honest number for it. Past that, the service degrades for everyone already inside.
One intake per year follows from the same logic. The roadmap is an annual document built before the year begins. A member who joins midway has missed the research prepared for that year. Enrolment opens before the year starts so every member receives the same advance reading and the same twelve months of research. When the 72 seats are filled, or the enrolment window closes, the page closes with it. There is no rolling midyear intake. The next enrolment period is the following year.
Three tools. Each standalone. All optional.
These exist for the member who wants a specific edge beyond the annual roadmap. The membership is complete without any of them, and nothing below changes what you receive as a member.
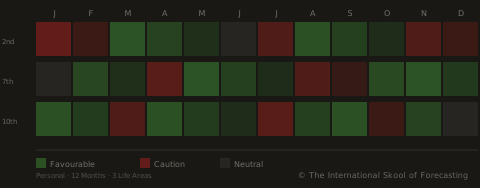
The House of Influence Report
A 12-month personal calendar built from your birth details. Each month is colour-coded by life area: wealth, career, partnerships, health. Green means the planetary transits are working with you. Red means they are not.
One chart. No interpretation required.
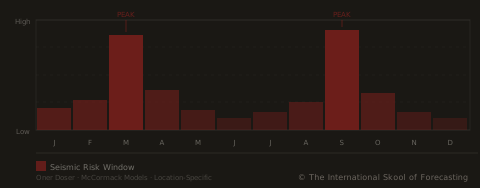
The Localized Defenses Report
A time-windowed risk report for your specific address, applying the same cycle-timing work the desk runs on markets to flag earthquake-cycle probability and rain and storm intensity windows.
If you own land, farm it, or protect property from flood or seismic risk, this gives you the windows before they arrive. They are pressure windows, not warnings, and nothing in the report replaces an official hazard service.
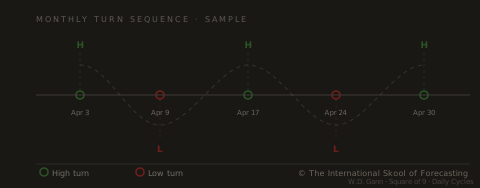
Square of 9 Elite Timing
Each month we publish a sequence of high and low turn dates for your two chosen markets, derived from W.D. Gann's Square of 9 and daily cycle methodology.
The annual roadmap gives you the trend. This narrows the timing to specific turn-date windows for your two chosen markets, month by month — windows to watch and test against price, not a guarantee of any single day.
Limited to 10 members per year.
These are presented at checkout after you select the annual membership above.
The Forecaster delivers the finished roadmap. The Market Forecaster adds the full method library and training.
This page sells the finished map. You receive the roadmap, the calendar, the briefings, and the forum, kept current for twelve months. You do not learn to build the map yourself, and most members do not want to. They want the desk to do the work and hand them the result. That is the right choice for an investor who is busy, serious, and after the output.
The Market Forecaster is the all-in path. It carries the full library of courses that teach the method behind the desk — how the cycles are read, how the evidence is layered, and how the research is built — and it locks in the member rate across the program. It is for the investor who wants to own the method, not only the finished research, and study the work over years.
The simple way to choose. If you want the year-ahead map delivered, stay here and join The Forecaster. If you want the map and the method, and the locked-in member rate across everything, look at the all-in path.
Want every course and the locked-in member rate? See The Market Forecaster.
The questions a serious investor asks first.
Is this a signal service or a trade-alert room?
No. There are no buy or sell alerts, no entries, and no exits. The desk publishes a year-ahead map — the roadmap across six markets, the pivot calendar, and twelve monthly briefings — and you make your own decisions inside that frame. If you want a screen that tells you when to click, this is the wrong desk.
Is the record a guarantee of future results?
No. The documented record is evidence that the method deserves study. It is not a promise that the next window behaves the same way. Markets invert. The work is to map the window, then test it against live structure. Every case in the record sits beside a boundary for exactly this reason, and the boundary is part of the case.
Do the windows give me precise days and price levels?
No. The calendar marks timing windows — weeks where the cycles flag a likely change in direction — with probability context. A window is a region of pressure on the calendar, not a single day and not a price level. You watch the window and test it against the tape. The desk reads the window. It does not name the day.
Will this teach me to build the forecast myself?
No. The Forecaster sells the output, not the method. The desk does the cycle research and the synthesis and hands you the finished map. If you want to learn to draw the map yourself, that is a different path — the courses inside The Market Forecaster — and it has its own page.
Why is the price what it is, and what do I actually get for it?
The annual membership is AUD $1,397 for twelve months — roughly $116 a month. For that you receive the Annual Roadmap across six markets, the Master Pivot Calendar, twelve monthly briefings written by hand, and access to the members forum. The full year is delivered from the start and is non-cancellable, because the roadmap is built before the intake opens. The membership gives you the result of weeks of desk research, kept current through the year.
Can I get a refund if the year does not go the way the map suggested?
No change-of-mind refunds once access is released. This does not limit your rights under the Australian Consumer Law. The map is research delivered in advance, and once it is in your hands the transfer is treated as final. Read the terms before you join, because that condition is not a formality — it is the deal. If certainty is what you need before you commit, this is the wrong room and a refund clause would not fix that.
What is the verification step, and why is there one?
Enrolment is subject to identity verification and a non-disclosure agreement covering the research. A person reviews each submission by hand. The step protects the work and the small group of members who paid for it from being repackaged and spread. If verification cannot be approved, no access is released and we work with you directly to resolve it.
Why only 72 seats, and why one intake a year?
A year-ahead reading holds its value in a small room and thins out in a large one. The forum stays a conversation at seventy-two and becomes a feed at ten times that. And the briefings are written by hand, so there is an honest ceiling on how many members one desk can serve well. One intake a year follows from the document itself: the roadmap is built before the year begins, so everyone enters with the same advance reading and the same twelve months ahead.
I am not a professional analyst. Is this still for me?
It can be, if you are a serious investor who reads the market closely and can hold probability and uncertainty at the same time. You do not need a finance degree or a trading desk. You need the temperament to act on a strong reading while accepting that markets invert, and the discipline to work with the map rather than file it away.
Is this financial advice?
No. The desk publishes research and education only. It does not know your account or your obligations and it recommends no position. If you need licensed guidance for a decision, take it to a qualified financial adviser. Nothing here removes that responsibility from you.
You can keep reading about the turn after it happens. Or you can enter the year with the map already drawn.
The investor who reads the commentary is always one move behind. The turn comes, price moves, and the clean explanation arrives a week later. By then the next window is already forming with no one watching it.
The investor with the roadmap stands somewhere else. They start January with the year drawn across six markets. They meet each pivot window prepared because the calendar told them it was coming. They keep a living map all year because the briefings keep it current. They are in front of the calendar, not behind it.
That is the choice on this page. Not a better signal. A different position relative to time. You stop reacting to the move and start planning around the window. You become the investor who meets the year prepared, not the one who explains it afterward.
Here is exactly what changes hands. The Annual Roadmap across six markets, in front of you before January. The Master Pivot Calendar, marking the timing windows month by month. Twelve monthly briefings, written by hand, correcting the map as the tape argues back. The members forum, all year. AUD $1,397 for the twelve months — roughly $116 a month for a build that takes the desk weeks and that you could not reasonably assemble alone while running a portfolio.
Seventy-two seats. One intake. When they are gone, this page closes until next year.
Secure your position forAUD $1,397 · 12 months · Identity check and NDA required before access is released · no change-of-mind refunds, which does not limit your rights under the Australian Consumer Law. If verification cannot be approved, no access is released and we work with you directly to resolve it.
P.S. If you read nothing else on this page, read this. In November 2019, with the Dow at a record high and no virus in the news, this desk put a low in March on the calendar and sent it to members. The Dow bottomed on 23 March 2020 at 18,591.93 — 37% below the 29,551.42 close it set on 12 February. That map was built four months early, which is how every annual map is built. The Forecaster is that map: the Annual Roadmap across six markets, the Master Pivot Calendar, twelve monthly briefings written by hand, and the members forum, kept current for twelve months. AUD $1,397 for the year, seventy-two seats, one intake. Secure your position →
P.P.S. The record is real and the boundary is real. Every documented case sits beside a limit, because the method deserves study, not because it guarantees the next year. If you read the record and think it proves the future is certain, do not join. If you read it and think the method is worth a year of serious attention, enrolment is available during the current intake.
P.P.P.S. Enrolment opens once a year. There are 72 seats, one intake, and then the page closes until the following year. There is no rolling midyear entry because the roadmap is built before the year begins and a late member would miss the research prepared for that year. If seats are available now, this is the current intake. The next one is twelve months away.
And if you want the method, not only the map: the all-in path carries the courses that teach how the desk reads the cycles and draws the roadmap, with the member rate locked in across everything. See The Market Forecaster.
The map for is being built right now. It goes out once, in November, to whoever is holding a seat.
The Forecaster is not a newsletter you can join mid-stream. It is a year-ahead roadmap across six markets — the ASX 200 (XJO), the Dow, the Nasdaq, the S&P 500, Bitcoin and gold — plus a Master Pivot Calendar and twelve monthly briefings, all built before the year starts. That is why there is one intake and why it opens in November: a year-ahead reading has a start date, and joining in June means buying a map of a road you have already driven.
How to be there when it opens. There is one way, it is free, and it takes about a minute.
Create a free account, then turn your notifications on.
We do not run a mailing list. The intake announcement goes out inside the members community and nowhere else, so a free account is how you hear about it — and the seats are finite, which makes the difference between choosing to join and finding out it already closed.
The step people skip: switch notifications on once you are in. An account with notifications off will not tell you anything. Thirty seconds in your profile settings, and the announcement reaches you the moment it goes live.
It costs nothing and obliges you to nothing. While you are in there you can read what current members are working through and decide whether this desk suits you by watching it operate, rather than by reading a page about it.
Create a free accountFree. No card. Turn on notifications once you are inside.
And if you would rather not create anything at all, the archive below is open and costs nothing. Six years of forecasts across a seven-year span — there is no 2021 in it, and I have not hidden that — each published before the year it covered, with what actually happened recorded beside it and a plain limit stated on every single case. Read it the way you would read anything before committing capital: slowly, and looking for the boundary as hard as you look for the win.
The desk opens once a year, on purpose. This is the right time to read the record, not to rush an entry.
The Forecaster is an annual document. The roadmap is built before the year begins, so the appropriate time to join is before the year starts. A member who entered midway would miss the research prepared for that year. Enrolment therefore opens once and then closes because the product has a defined annual start date.
So the closed season is not a dead period. It is the period for due diligence. The whole record sits open below. Read it the way a serious investor reads anything before committing capital: slowly, and looking for the boundary as much as the win.
Look at what each case actually claims. The 2020 forecast put a low in March, before the crash bottomed on 23 March with the Dow closing at 18,591.93. It did not name the cause and it did not name the day. It named the month, and the month held — that is the whole of the claim. The 2022 gold forecast set a target near $1,621, and gold’s low that year came in around that level — the lowest close was about $1,622, with intraday prints varying by feed. One target landing close is evidence the geometry deserves study, not proof the next one lands the same way. That pattern — a documented claim, a recorded outcome, and a plain limit beside it — runs through every entry in the archive.
If that careful framing is what you want from a research desk, a free account in the members portal — with notifications switched on — is how you will hear the next intake called. If you wanted a desk that claimed it called everything perfectly, the restraint in this record would disappoint you, and you would be better served elsewhere. The record is built to earn trust, not to impress.
While the desk is closed, you can do the one thing that makes a future membership pay off faster: arrive with context. The foundation studies below establish the framework the annual service runs on. Start with the 18.6-year tide.
Six years, all published in advance. Five of them closed and checkable. The sixth is still running.
The Pandemic Crash Warning.
Issued November 2019. Identified the February peak and the March crash window four months before the event. The DJI fell 37%, peak close to trough close.
Read the record → 2022 · The HarmonicThe Gold Target: $1,621.
Stated the downside target for gold in advance. The market bottomed in the $1,620s, near the call.
Read the record → 2023 · The ContrarianThe Recession That Never Came.
While economists predicted a crash, we identified the March bottom and the start of a 24% S&P bull run.
Read the record → 2024 · The FrequencyFourier vs. The Halving.
Fourier-cycle work challenged the simple halving narrative. Bitcoin chopped through the first half, then launched in Q4.
Read the record → 2025 · The TransitGold, and a claim I am not going to make.
A date was set in advance and gold rose after it — but gold set records almost continuously through 2025, so that is not evidence and I do not present it as any. The record shows the date held.
Read the record → 2026 · The StressThe 2026 Stress Window.
Published before the year began: a fracture-risk reading across a specific bloc of nations. The year is still running, so this one counts as published, not as a result.
Live thesis →While you wait,
prepare the ground.
Serious students arrive with context. The research below establishes the historical and mathematical framework the annual service runs on. A member who already knows the long cycles reads the roadmap faster and trusts it on firmer ground. Start with the 18.6-year tide, then the lineage, then the limits of the work. Read in that order and the next intake will make sense from the first briefing.
-
01.
The 18.6-Year Economic Tide
Locating our current position in the long-wave real estate cycle.
-
02.
The Historical Lineage
The four masters whose tools power the annual roadmap.
-
03.
The Probability Framework
A clinical look at the limits of time-cycle science.