
2024 · The Dow year walked — five dead dates counted 6.9% · The sun's speed variance across the year AUD $2,997 · One payment · Lifetime
Enrol →
A personal note on what the method actually is, and who it is for

Use the Sun's actual motion to calculate market-turn windows. A flat 90-day count can be off because the solar quarters are different lengths.

The solar quarters run 92.76, 93.65, 89.84 and 88.99 days. Those figures explain why a flat calendar count can drift away from the solar position used in a market-timing study. The method is measurable and checkable; the course applies it to market charts.

The practical result is a dated turn window rather than a calendar estimate. The course teaches the calculation, the chart-only shortcut, and the 2024 Dow study with successful and unsuccessful dates identified. A window tells you what to investigate; it does not guarantee a market move.

A reading anchored to the sun's true position does not carry that error. It names a window — a short period when the market is likely to change trend — and it names it months in advance. You watch price for confirmation inside the window. You do not chase it. The window is not a magic date; it is a probability zone, and reversals that miss it simply move to the next one. The price is one number, plainly stated. The work is real work. Read it slowly.

What this letter covers
Before you continue

Decide quickly whether this is the right course for you.

This is a solar-degree timing course. You learn to calculate dated market-turn windows from the Sun's actual motion and test them against price. It does not tell you what to buy.

You learn

The full solar-degree method, the chart-only shortcut, and the way confluence narrows a window.

Proof to inspect

The 2024 Dow Jones study, including five dates that did not produce a turn.

Important limit

A window is an investigation point, not a guaranteed signal or financial advice.

Terms

AUD $2,997 once. Lifetime access after identity verification and an NDA. No change-of-mind refund after access; Australian Consumer Law rights remain.

Enrol in the course One payment. No signal subscription.

Picture the trade you remember most. The one where the market turned and you were a week early. Or a week late. You had the direction right. You read the chart, you sized the position, you waited. The turn came — but not when you thought it would. So you sat through a drawdown you did not need to sit through, or you took the entry too soon and got stopped before the real move began. The loss was not in your analysis. It was in your timing.

Every serious trader has that trade. Most have a stack of them. The pattern is always the same. The direction was readable. The week was not. Price told you the trend. It did not tell you the date.

Price is a record of what already happened. By the time the chart confirms a turn, the turn is behind you. The forecaster's question is the opposite one. Not "what just turned" — but "when is the next turn due."

W.D. Gann left the answer to that question in plain sight, and then he buried the working form of it. The central idea is simple to state. The sun moves through the year at a changing speed — faster in some seasons, slower in others. Its apparent speed varies by 6.9 percent, from 0.9534° a day in early July to 1.0193° a day in early January. So the four true quarters of the solar year are not 90 days each. They run 92.76, 93.65, 89.84 and 88.99: a spread of 4.66 days between the longest and the shortest.

A flat day count cannot hold that. Thirty days, sixty, ninety — those are approximations, and the error rebuilds every season until the dates they produce no longer line up with anything.

A reading anchored to the sun's true position does not carry the error. When the sun returns to the position it held at a prior major turn, the market reaches a sensitive time window. That is the whole claim. One sentence, and you can go and break it on your own charts this week — which is more than most methods will offer you. The record on this page is why I think it deserves your study. It is not why you should believe it.

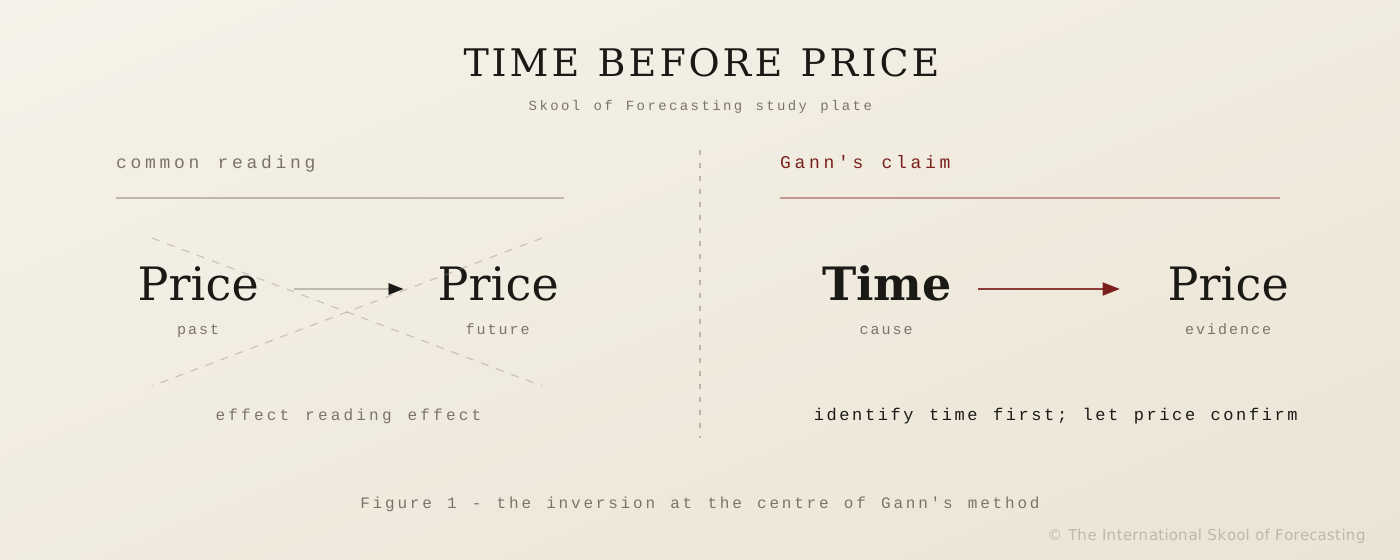
Gann said it plainly in print. In Truth of the Stock Tape (1923) he told readers to "watch for change in trend every 3rd, 6th, 9th and 12th month … if a stock makes bottom in the month of August … the most important date would be the following August or one year later." He studied the time condition first, then watched price for confirmation. That order is the whole edge. Reverse it — read price first, look for time after — and you are back to chasing the move once it is already obvious.

The idea is the easy half. The hard half is the reading — telling a strong window from a weak one, handling the seasonal gates, and letting the moon and eclipses narrow the months to watch.

That working form was never set out in print as a procedure. What Gann put on the page — The Tunnel Thru the Air and the course material that followed it — was the philosophy, written into old prose and parable, encoded on purpose so a casual reader would pass over it. He gave the reasoning. He withheld the steps. A hundred readers have interpreted the same passages a hundred different ways, and most of them are wrong, because the source was written to be misread by anyone who had not done the work.

I have done the work. More than a decade of reading, testing, and refining the source against real charts — and in that decade I have shown the working form to a few dozen people, no more.

Let me be careful about what I am claiming there, because this is where courses like this usually overreach. I am not going to tell you the underlying idea is a secret. It is not. Solar-degree cycle tools ship inside commercial charting software and you can read their manuals for free this afternoon. What is not written down anywhere — not in the manuals, not in Gann — is the order of operations, the filters, and which dates to throw away. That is the whole of what I sell, and this letter is the case for coming and getting it.
§ The problem

Why this method is difficult to learn from the source alone.

There are two reasons the timing layer stays out of reach. One is old. One is new. Together they explain why a method this useful is still rare.

The old-source problem

The material exists. It sits inside Gann's books, where anyone can buy them. So why can almost nobody use it? Because the source was built to resist a casual reader, and time has made it harder still.

It is hidden inside century-old prose and religious parable. Gann wrote the timing work into passages that read, on the surface, as story and scripture. A modern reader without a guide skims past the instruction and never sees it. The framework is there. The mechanics are not. Gann gave the philosophy of why time governs markets, and he withheld the calculation sequence that turns the philosophy into a date.

It has no clear bridge to a modern chart. Even the rare reader who decodes a passage cannot easily translate it to a trading platform. The source assumes tools and habits that no longer exist. And because Gann encoded the method on purpose, it has been interpreted a hundred ways by a hundred practitioners — most of whom guarded their reading, taught no one, and left no public trail. The interpretation is the product. Without that interpretation and working sequence, the books are difficult to apply.

Gann gave the framework and withheld the working form. A hundred years later, the framework is public and the working form is still rare. That gap is the whole reason this course exists.

The modern-market problem

Now set the old books aside and look at what a serious trader studies today. Technical analysis — price patterns, read after price has moved. Fundamentals — earnings and macro data, the slowest layer of all. Sentiment and order flow — a map of where money went yesterday. Each of these is real work. Each of them is useful. And not one of them tells you when the next reversal is due.

They all react. They describe the move after it has started. That is why the same mistakes repeat, year after year, in the accounts of people who are not careless and not new:

You enter a trend too early and burn capital on whipsaws while you wait for the real move. You exit a winner too soon and watch the profit you left on the table double without you. You chase a move that is already ten or twenty percent extended, because by the time it looked obvious it was already late. You hold a loser into a reversal that the timing layer would have flagged weeks earlier.

The timing layer sits above price. It moves first. But nobody teaches it, because it was never popularised — and the cheap substitute, simple calendar counting, fails for a reason most traders never diagnose. A thirty, sixty, or ninety-day count assumes the earth moves at a constant rate around the sun. It does not. The orbit is elliptical. The sun's apparent speed changes through the year. So the flat count drifts, season by season, until the dates it produces no longer line up with the market. The serious forecaster needs the sun's true position, not an approximation that quietly accumulates error.

Two-column study plate: on the left, price read against price, past to future; on the right, time treated as the cause and price as the evidence that confirms it.
Price read against price answers late — time read first tells you what to watch for

That is the gap this course closes. It teaches the working form Gann withheld, and it bridges it to the chart you actually watch. The next section is what that working form contains.

§ The method

You will work through one complete method and learn how to apply it again.

You are not watching a video series. You learn to read a window, test it against the chart, and mark it in advance. Each unit adds a tool to the same craft, and the units build in order. The first gives you the way of thinking. The last shows the whole craft worked on a real year, over your shoulder. What follows is what each unit teaches you to recognise — not the counting procedure, which is the part you do by hand inside the course.

Unit One · Time by Degrees

This is the foundation, and it is mostly unlearning. You start by seeing exactly why price is late, and why the flat day counts you may already use drift out of line as the sun changes speed through the year. Then you learn what a solar-degree window actually is — a short period where seasonal rhythm and the sun's position line up with prior swings — and, just as important, what it is not.

Why it matters. Most people who fail with timing fail here, before they begin, because they treat a turn date as a magic day on the calendar. It is not. It is a window, and a window is a probability statement. Get this wrong and every later unit becomes superstition. Get it right and the rest of the course is just craft. What you learn to recognise: the difference between a date the market must obey and a window the market tends to respect. You leave with a working vocabulary and the right way to think about a turn.

Unit Two · Counting with Time

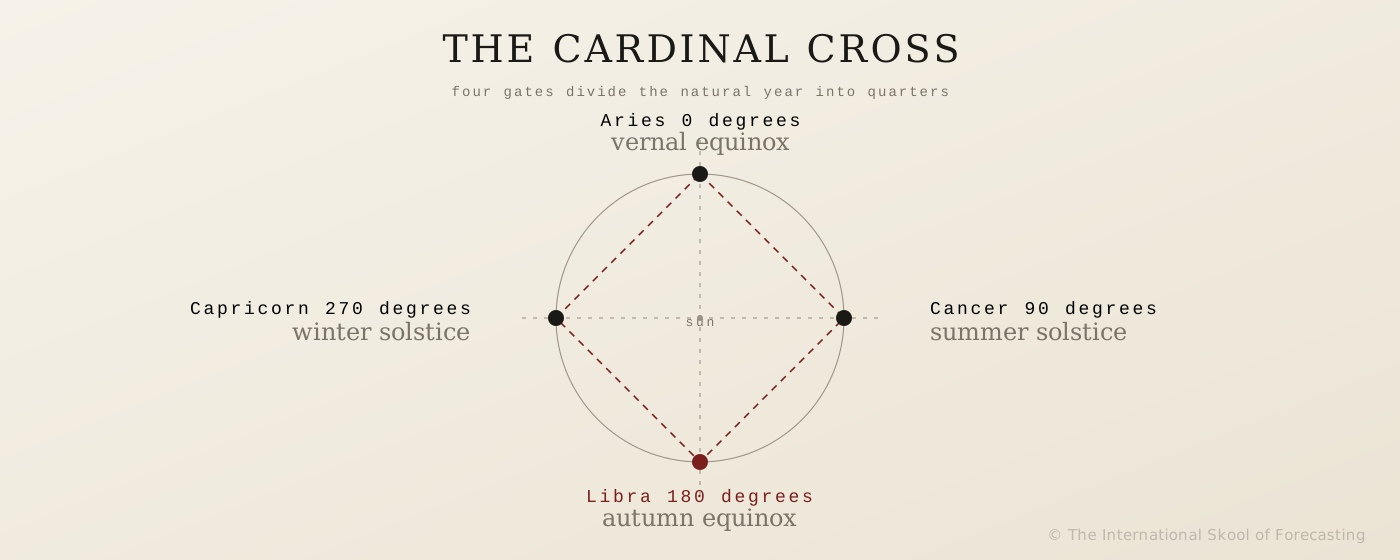
The four cardinal points of the solar year — the spring and autumn equinoxes, the summer and winter solstices — and how major swings cluster around these seasonal hinges. These points divide the market year into quarters, and the character of the market changes as it crosses from one quarter to the next. You learn to carry a prior high or low forward to the months worth watching.

Why it matters. A window with no frame around it is just a guess. The cardinal points are the frame. They tell you which windows sit at the strong seasonal hinges and which fall in the dead middle of a quarter where the market is less likely to listen. What breaks without it: you treat every window as equal, you act on weak ones, and the method's accuracy collapses under the false signals. What you learn to recognise: a strong seasonal window from a weak one — and the discipline to test the reading against current structure rather than trusting it blind.

Unit Three · The Lazy Man's Method

The chart-only way to mark repeating turn dates without an ephemeris. You learn to read the same dates recurring across markets, month after month, using nothing but the chart in front of you and your own eyes. It is the simplest thing in the program. I have never taught it anywhere else, and I ask buyers not to pass it on.

Why it matters. The deeper method takes study. This one takes minutes, and it runs as a standing reality check on everything else. Mark the highs and lows going back across a year and the same dates start to surface — across every instrument you look at, not only the one you traded. What you learn to recognise: the repeating turn dates that were always on your charts and that you never saw. Once you see this, you cannot unsee it. That is not a sales line — it is what students tell me afterward, and it is why an hour of Module Three is the part most of them end up rating highest out of all twenty-five lessons.

Unit Four · Tools and Confluence

Seven lessons. It is the heaviest module in the course and the one where the reading stops being theory. A spreadsheet that does the arithmetic once you understand what it is doing. The lunar layer, which narrows the months and weeks of highest probability — important tops and bottoms often fall near eclipses, and an eclipse can mark a change in the market that a price chart only confirms afterward. A weather-confluence lesson, which is the strangest hour in the program and which you are free to throw away. And the rules for scoring a date before you act on it.

Why it matters. This is confluence, and confluence is the heart of responsible timing. When two independent layers — the solar window and the lunar cycle — agree on the same period, the reading carries more weight. When they disagree, you stand down. What breaks without it: a single layer gives you too many windows and no way to rank them; you act on all of them and the noise drowns the signal. What you learn to recognise: the weeks where the layers stack, which is where the highest-probability turns live. This is not a second opinion bolted on. It is built into the reading.

This module is also where both worked cases sit. The first is the 2024 Dow Jones, walked over your shoulder across a full year. You watch the turn dates tracked month by month, see which gave tops and which gave bottoms, and learn to read a market building toward a major turn. When turn dates start piling up on tops, the chart is telling you a top is forming — it might not be this month, but it is coming. Theory without a worked year leaves you with a vocabulary and no instinct. This is where the instinct forms.

You learn it the honest way, too. Not every call in that year was right. Five dates did nothing at all, and I mark them in a different colour and count them out loud, because the point is the work shown, not a clean highlight reel. You see swing high and swing low calls no signal service would show you, and you see where the method had to defer to structure.

The second case is the one you should weigh more heavily, because it is the harder test. A cold start on India's Nifty 50: an index I do not follow and have never traded, its turn dates derived from scratch, the cluster left to fall where it falls. If this method only worked on instruments I had studied for a decade, that lesson could not have been filmed.

Unit Five · Advanced Applications

The same reading, pushed in both directions. Down to short-interval intraday charts. Out to long-range maps that run years rather than months. Then a session working common mistakes off real student charts — the errors people actually make, not the ones a course invents. It closes with the annual map and the NDA.

Why it matters. A method you can only run on a daily chart is a method you will abandon the first time your timeframe changes. This module is what makes the reading portable. Why it is last: the student-chart session only works once you have made a few of those errors yourself. Read it before you have done the work and it is a list. Read it after and it is a correction.

§ Before and after

Use the window to plan research before price confirms the move.

Before the course

You enter early because you do not know which week the real move begins.

You hold winners too long because you cannot see when they are due to roll.

You lean on price signals that lag by days or weeks.

You react to news you did not anticipate, and feel a step behind the room.

Your backtests look fine, but forward-testing fails — because you have no forward-looking calendar.

After the course

You know months ahead which windows are likely to turn the market.

You plan the calendar backward — mark the windows first, then decide when to be active.

You test your other analysis against the calendar instead of running it blind.

You read whether a market is healthy or rolling over by where its turns are landing.

You merge timing with structure — solar window, lunar confluence, support and resistance — into one reading.

The shift is not that you suddenly predict the future. It is that you stop being surprised by the calendar. The turn was always coming. After the course you knew the window it was coming in, you watched price confirm it, and you acted with the position already planned. That is the entire difference between a forecaster and a reactor. One studies time before the move. The other studies price after it.

§ Proof walk · The study plate

The four solar quarters are different lengths.

The plate shows the cardinal cross of the solar year. Four gates divide the year into quarters: the vernal equinox, the summer solstice, the autumn equinox, the winter solstice. Major swings cluster around these seasonal hinges. The course teaches you to read a market against this frame, then carry a prior turn forward to the months worth watching.

The frame is what you build. Below it is the record, and I hold it to one rule: a result only counts if there is a date on the document that produced it. That rule is why the list is three items long instead of thirty. It is evidence that the timing layer deserves your study — not a promise about the next window.

The cardinal cross of the solar year — the four seasonal gates that divide the market year into quarters.

2024 · The Dow Jones, worked in full

Which brings me to the one that survives that standard. This is the case study you watch inside the course, and it is the most honest piece of proof on this page — because the work is shown, not just the result. Across 2024, the daily turn dates are tracked through the year. You see which dates gave tops and which gave bottoms. You see how a cluster of turn dates landing on tops signals a major top building. And you see the five dates that did nothing at all, marked in a different colour and counted out loud, in a single year's worth of windows. That is the number I would leave out if I were selling you a highlight reel. It is in because the point is not that every date fires — it is that the distribution of what lands is readable, and you cannot learn to read a distribution from winners alone. No signal service shows you the swing high and swing low formations the way this study does.

Read the record for what it is. Three dated examples — one of them thrown out by me, one of them carrying five failures I counted myself. That is a short list, and it is short on purpose. A guru page would promise more and prove less.

If the method is what you came for, you have it.

One payment. Lifetime access. No change-of-mind refunds once access is released. This does not limit your rights under the Australian Consumer Law. NDA and ID verification on enrolment.

Enrol — AUD $2,997
§ How it is taught

The method is worked through, step by step.

There is a way to teach this badly. You explain the philosophy, hand over a list of rules, and leave the student alone with a chart and a hope. That is how most Gann material has always been taught, and it is why most Gann students never get past the books. The rules sound right. The reading never comes.

This course is built the other way. You are shown the method being worked, not handed a theory and left alone. Every concept arrives attached to a real chart, marked in real time. When I read a window, you watch the window get read. When a date gives a top, you see the top form on the date. When the moon and the solar window agree, you watch the agreement narrow the reading from a month to a week.

The spine of the apprenticeship is the 2024 Dow study. It is not a slide. It is a year of a real market, walked date by date, with the calls and the misses both on the table. You sit at the desk while the work is done. By the time the year closes, you have not just learned the rules — you have watched a forecaster apply them under live uncertainty, defer to structure when structure disagreed, and read the market's own turns as a running report on its health.

A theory tells you what should happen. An apprenticeship shows you what to do when the market does something else. This is the second kind.

Behind the desk is more than a decade of reading, testing, and refining the source work. This is not a collection of Gann quotes assembled into a course. It is a working research tradition, taught by someone who has spent the years it takes to make the source usable. The value is in the interpretation, the application, and the review — the three things the books leave out and the three things you cannot get on your own.

§ The offer

The price, what you receive, and the refund terms.

The course is the artefact. Everything else is the exchange rate. Three numbers decide whether this is a good trade for you: what you build, what you pay, and what it costs you to walk away without it.

What you build. The skill to read a turn window by hand, months ahead, for any market you watch. By the end you can mark the four seasonal gates, carry a prior turn forward to the months worth watching, sharpen the reading with the Lazy Man's Method, and narrow it with the moon and eclipses. The skill is yours. There is no subscription, no renewal, and no dependency on Skool of Forecasting once you have it. You re-run the same reading on every future cycle, on equities, indices, currencies, and commodities alike, because the method scales across markets and timeframes.

What you pay. One payment. AUD $2,997. Lifetime access after identity verification and a signed NDA. There are no change-of-mind refunds once access is released — though that does not limit your rights under the Australian Consumer Law, which cannot be signed away. It is stated up front rather than buried — because a research program of this kind has to treat the transfer of the method as final, and you should decide with that in full view.

What it costs you to walk away. The next window arrives whether you can read it or not. It always does. The question is only whether you read it before it opens or recognise it afterward in hindsight. A trader who learns to read the window once carries that skill for the rest of a research career — every year, every market, every cycle. Walk away and you keep paying the old tax: early entries, late exits, chased moves, and turns that surprised you when they did not have to.

Twenty-five lessons, five modules · what each one leaves in your hands

  • Time by Degrees — the way of thinking about a turn as a window, and the working vocabulary that keeps you from treating a date as magic.
  • Counting with Time — the four cardinal points and the skill to tell a strong seasonal window from a weak one, tested against current structure.
  • The Lazy Man's Method — the chart-only reading of repeating turn dates, with no ephemeris required, that works as a standing check on everything else.
  • Tools and Confluence — seven lessons: the spreadsheet, the lunar layer that narrows a month to a week, the scoring rules, the full 2024 Dow year with the misses counted, and a cold start on an index I have never traded.
  • Advanced Applications — the reading pushed down to intraday and out to long-range maps, then common mistakes worked off real student charts.
  • Lifetime access — every unit, every future refinement, re-run on any cycle for the rest of your research life. One payment. No renewal.

The tools you need to do the work are free. A free online ephemeris is the working tool used throughout, and the lessons walk you through setting it up. The Lazy Man's Method needs no ephemeris at all. There is nothing to buy beyond the course, and nothing to keep paying for once you own it.

Set that against the market it sits in. Astro-timing and forecasting services of this kind are sold by subscription — often four figures a year, renewed for as long as you watch the market. Specialist forecasting courses run from the high hundreds to several thousand dollars. This is AUD $2,997, paid once, with lifetime access and every future refinement included. The contrast is plain: rent a forecast feed by the year, forever — or own the reading once, for life. You learn to mark the window yourself, on a free tool, and no one needs to mark it for you again.

§ Why this is gated

Why access requires verification and an NDA.

The idea sits in W.D. Gann's work, written in old prose and parable that most readers cannot parse alone. What is not in print is the working form — how to read a window, tell a strong date from a weak one, and let the moon and eclipses sharpen it. That working form took more than a decade to assemble against real charts. It is the product.

If that working form were handed out openly, the edge would thin for everyone who did the study. A method that names a turn window works in part because few people are reading the same windows. Publish it to the open market and you weaken it for every student who paid to learn it in full. So the gate is not theatre. It protects the thing you are buying.

This is why I have only ever taught the method to a small number of people, and why I ask that the group stay close — that students not explain the methods or the calculations used to reach the conclusions. Public exposure weakens the advantage. Keeping it private is what keeps it effective, year after year.

When you enrol, you verify your identity and sign an NDA covering the course materials and the method. A person reviews each submission by hand. The verification does two things at once. It keeps the room serious — students, not scalpers reselling the method into a signal feed — and it confirms that the people inside are there to study. If verification cannot be approved, no access is released, and we work with you directly to resolve it.

The refund clause. No change-of-mind refunds once access is released. This does not limit your rights under the Australian Consumer Law. The verification step protects the method and the community, not your right to a refund — if verification cannot be approved, no access is released and we work with you directly to resolve it before any access opens. Read the terms before you enrol, because once you are in, the research is in your hands and we treat that transfer as final.

§ Fit

Who this course is for, and who should not enrol.

Built for

Traders and investors who study price after it moves and want the timing layer that moves first. Cycle researchers who already know Gann's name but cannot get from his theory to a working method. Serious students willing to spend a few weeks learning, testing, and drilling the reading before they trade it forward. Anyone who backtests their analysis and wants a forward-looking calendar to lay on top of it. Researchers who want a structured method and the discipline that comes with it — not a feed of alerts.

If you can read a chart and use a free ephemeris on a website, you have the prerequisites. You do not need an astrology background. The course teaches the astronomy from first principles as you go.

Do not enrol if

You want buy and sell alerts

This teaches the calendar window, not the execution, and there are no daily signals — the method is for the trader who wants to do the work themselves.

You need certainty before you act

These are probability windows, not guarantees. A turn date is where the market tends to reverse, not where it must. If you need a promise, this isn't it.

You want a quick hack, not a skill

There is no way to automate the reading with no learning curve. You have to work through the units and drill the reading before it is useful.

You will not verify your identity or sign the NDA

Both gates are non-negotiable. They are what keeps the room serious and the method worth learning. If either gate is a problem, this is the wrong program, and that is better to know now.

§ Objections · Asked and answered before you spend a dollar

Seven fair criticisms of this method. Here they are, up front.

A page that only tells you what is strong about a method is an advertisement, not an honest account. These are the questions a skeptical, careful buyer should ask.

"This is astrology. Why would I trust it for money decisions?"

Because that is exactly what it is, stated plainly rather than dressed up as something else. This course teaches a solar-degree timing method built on the sun's changing speed through the year, read against a chart. If that premise is not one you can work with, no amount of copywriting should talk you into it. If you can hold the premise loosely enough to test it against the historical record yourself, the method is worth studying on its own terms.

"Isn't this just Gann repackaged? Can't I read the books myself?"

You can buy the books today for a fraction of this price, and you should — the philosophy is public. What is not public is the working form: the order of operations, the filters, and which dates to throw away. That reconstruction is more than a decade of work against real charts, and it is the thing this course actually sells. If you would rather spend years decoding the source yourself, that is a legitimate choice, and this course is not for you.

"AUD $2,997 is a lot of money for one method."

It is, measured against a single idea. Measured against a skill you re-run on any market for the rest of a research career, with no subscription and nothing further to buy, the arithmetic changes. If you only want to test the idea once, this is too much to pay. If you want the timing layer permanently, it is one payment for something that does not expire.

"How do I know the case studies weren't cherry-picked?"

You don't, on the strength of a sales page alone — that is a fair thing to be skeptical of, and no page can settle it. What a page can do is show its working. This one is dated, specific, and leaves the misses in: the 2024 Dow study is shown with the five calls that did nothing, not only the ones that landed, and the standalone proof is the 2024 Dow study, with its unsuccessful dates shown alongside the successful ones. Cherry-picking is choosing your evidence after you know the answer. A published date is the one thing that makes that impossible. The stronger answer is inside the course, in Module Four — a cold start on India's Nifty 50, an index I do not follow and have never traded, worked from scratch on camera with the cluster left to fall where it falls. A method that only performs on charts I have studied for a decade could not survive that lesson. It is there precisely because this is the objection I would raise.

"Why does a course need an NDA and an identity check?"

Because the product is a reading method that works in part because not everyone is reading the same windows. Publish the working form openly and it thins for every student who paid to learn it. The verification step keeps the room serious; it does not gate your consumer rights. If either requirement is a problem for you, that is worth knowing before you pay, not after.

"What happens if I pay and then decide it isn't for me?"

There are no change-of-mind refunds once access is released — that does not limit your rights under the Australian Consumer Law. The research is transferred the moment access opens, and there is no way to take that back. That is stated up front, not buried, so you can decide with it in full view.

"How is this different from a signal service or another Gann course?"

A signal service sells you an answer every week for as long as you keep paying. This sells you the method once, and you do the reading yourself, on any market, for the rest of your career. Other Gann material generally hands over the philosophy and leaves you to find the working form on your own — this course is built around teaching the working form directly, worked on a real chart.

§ Common questions

The honest answers.

Is AUD $2,997 worth it for one method?

That is the right question to ask, and the honest answer is that it depends on what the skill replaces. The method is not a one-year subscription you re-buy every December. It is a reading you own for life, re-run on any market and any cycle for the rest of your research career. Set the price against the cost of the problem it solves — the early entries, the late exits, the chased moves — across that many years, and the arithmetic changes. If you only want to test the idea once and move on, this is too much to pay. If you want the timing layer permanently, it is one payment for a skill that does not expire.

Does a hundred-year-old method still work in modern algorithmic markets?

It works on a horizon the algorithms do not trade. Quant and algorithmic strategies compete over milliseconds to days, training on recent price action. The solar-degree window operates on a seasonal and annual horizon that no short-term model is built to hold. The edge is not speed. It is time-scale. A reading that names a turn window months ahead does not compete with a model timing the next few minutes. They work on different layers of the same market. The 2024 Dow study and the dated record on this page are recent, not historical curiosities.

What if I don't know anything about astrology?

You don't need to. The course teaches the astronomy from first principles as you go. If you can read a chart and use a free ephemeris on a website, you have the prerequisites. The case study is a worked example — you can follow the reading before you grasp every variable, then build back up to it. Nothing in the method asks you to believe anything; it asks you to test a window against the chart and judge the result for yourself.

What if I don't have an ephemeris?

You don't need to buy one. A free online ephemeris is the working tool used throughout the course, and the lessons walk you through setting it up. The Lazy Man's Method goes further — it lets you mark repeating turn dates from the chart alone, with no ephemeris at all.

How is this different from the McWhirter method / FTT / other Skool courses?

The Skool teaches each method as its own discipline. Solar-degree timing names a turn window from the sun's position and the chart's own rhythm. The McWhirter method works the lunar business cycle. The Financial Time Table reads the long economic tide. They are complementary, and the Skool teaches them as separate courses so each can be learned deeply. This is the solar-degree one. It stands alone, and it is also part of The Market Forecaster bundle if you want the full set.

Can I use this for intraday trading, or only daily and weekly charts?

Both. The method works on any timeframe because the reading scales. A student who can read a daily window applies the same thinking to a shorter chart, and the same to a weekly one for position work. The course teaches the principle; you adapt it to the chart you watch. The case study runs on the daily Dow, which is the cleanest place to learn the reading, and the skill transfers down or up from there once it is solid.

What if I already use a different astro-timing service?

The course is most useful to you, not less. You learn why the method works the way it does, so you can read the window yourself rather than wait on a third-party feed. The student who finishes the course owns the skill. The service you use now can be checked against, or replaced by, the work you do yourself.

What if I don't like the course?

There are no change-of-mind refunds once access is released — which does not limit your rights under the Australian Consumer Law, and cannot. The research is in your hands the moment access is granted, and we treat that transfer as final. If verification cannot be approved, no access is released and we work with you directly to resolve it. Read the terms before you enrol. This is the honest way to gate a research program of this kind.

How long does the course take?

Self-paced. Plan on a few weeks of part-time study to watch the material, work the examples, and start testing windows on your own charts. There is no time limit — access is lifetime after verification, so you can return to a lesson whenever a live window calls for it.

What does the method not promise?

It does not promise a result. The method identifies timing conditions. It does not remove risk, and it does not tell you whether to buy or sell at any point — that is your judgement, applied with structure and risk management. A turn date is where the market tends to reverse, not where it must. Strong one-directional markets can run through a window for several days before they listen. Eclipses and lunar timing add confluence, not certainty; layering more agreement reduces false signals, it does not guarantee accuracy. The student still has to study, test, and judge. That boundary is stated plainly because the method is more useful to someone who respects it.

Who is this not for?

Traders looking for a signal service. Students who have not yet read the free library essay on solar ingress. Anyone who wants daily buy or sell alerts — we do not provide them, and the method is for the trader who wants to do the work themselves. Anyone who needs certainty before acting, or expects to automate the reading with no learning curve. And anyone unwilling to verify their identity or sign the NDA. Both gates are non-negotiable.

§ The decision

One payment. One method. Lifetime ownership.

The next turn window is already on the calendar, whether you read it or not. The only question is whether you read it before or after. The course is most useful the day you finish it — the work you do before a window is what gives you the standing to act when it arrives.

There are two kinds of trader. One reads price and reacts to what already happened. The other studies time and prepares for what is due. They can look at the same chart and see two different things — one a record of the past, the other a calendar of the year ahead. This course moves you from the first kind to the second. Not by promise. By skill you build and keep.

So here is the exchange, in plain terms. Twenty-five lessons across five modules. The four seasonal gates and how to tell a strong window from a weak one. The Lazy Man's Method, which needs no ephemeris and which I have never taught anywhere else. The lunar layer that narrows a month to a week. The full 2024 Dow year, walked date by date, with the five dead dates counted out loud — and a cold start on an index I have never traded, for anyone who suspects the first one was fitted after the fact. Lifetime access, one payment of AUD $2,997, and a free online ephemeris as the only tool you will ever need to buy — which is to say, none. Nothing renews. Nothing expires.

You did not read this far for alerts. You read this far because you wanted the layer that sits above price. The offer is open, the terms are plain, and the work is yours to do.

AUD $2,997
One payment · Lifetime access

Enrolment process — After payment, complete a two-minute identity check via Stripe (government ID + selfie) and sign a non-disclosure agreement. Course access is issued after both are reviewed. No change-of-mind refunds once access is released. This does not limit your rights under the Australian Consumer Law. This is educational research only. It is not financial advice and does not recommend any position. The method identifies timing conditions; it does not remove risk, and you still have to study, test, and judge.

Enrol — AUD $2,997

No change-of-mind refunds once access is released. This does not limit your rights under the Australian Consumer Law. · Identity check and NDA required before access.

P.S. If you skipped the letter, here is the whole of it. The four true quarters of the solar year are 92.76, 93.65, 89.84 and 88.99 days — a 4.66-day spread, because the sun's apparent speed varies 6.9 percent across the year. Every flat ninety-day count you have ever run is therefore out by up to 3.65 days, and rebuilds that error every season. This course teaches the reading that does not carry it: twenty-five lessons across five modules, ending in the full 2024 Dow Jones year walked date by date — including the five dates that did nothing, marked in a different colour and counted out loud, because I would rather you saw the distribution than a highlight reel. The strongest standalone proof is the 2024 Dow study, shown date by date with five unsuccessful windows counted openly. AUD $2,997, paid once, lifetime access, and the only tool the work requires is a free online ephemeris. No subscription. Nothing renews. No change-of-mind refunds once access is released. This does not limit your rights under the Australian Consumer Law. Identity check and NDA before access.

P.P.S. The reason to do it now is not a deadline — there isn't one, and I am not going to invent one. It is that a window is only worth anything to you if you can read it before it opens, and the reading takes a few weeks to drill. Start after the fact and you learn this year's turns the way everyone else does: from the chart, in hindsight, once the easy money has gone.

P.P.P.S. The Lazy Man's Method alone changes how you look at a chart. It needs no ephemeris and takes minutes to apply. Once you see the same dates recur across every market you watch, you cannot unsee them — and that one reading runs as a permanent check on everything else you do.

Time by Solar Degrees — Read the turn window months ahead. One payment. Lifetime access.
Enrol — AUD $2,997