From the desk of Jonathan Evans·Brisbane, Australia
Find which cycle controls the market when two cycles disagree.
In 2011, a silver cycle count I had checked three times still led to a loss of more than $50,000. The smaller cycle was not the controlling cycle. This letter explains how the Level 1 course teaches cycle ranking, nested cycles, cycle age, and confluence — the points where several cycles agree or conflict.
You found a cycle once. You marked the lows, counted the spacing, and the rhythm fit. It explained the last three turns. You trusted it.
Then you put it on a live chart. The setup looked clean. The price action agreed. You took the trade with confidence.
It failed anyway. Not because the cycle was wrong. Because a larger cycle was pulling against it, and your method had no way to rank the two.
Your count was right and still useless. That is the gap this letter is about — and it is the same gap that cost me the silver position.
Optional 3–8 min. Author intro, or a proof-of-concept demonstration of the methodology against a historical turning point.
Before you continue
Decide quickly whether this is the right course for you.
This is a cycle-reading course. It teaches you how to identify the dominant rhythm, rank nested cycles, and test whether a pattern survives beyond the chart that suggested it.
You learn
A repeatable process for measuring cycles, ranking them, and deciding which one controls the chart.
Proof to inspect
Bitcoin, Telstra, and Nifty 50 study cases, including one hit, one miss, and one open search.
Important limit
The cases are historical studies, not dated calls or guaranteed trading signals.
Terms
AUD $2,997 once. Lifetime access after verification. Commercial chart software is separate.
Most cycle work treats every cycle as equally important. That is why useful patterns can fail.
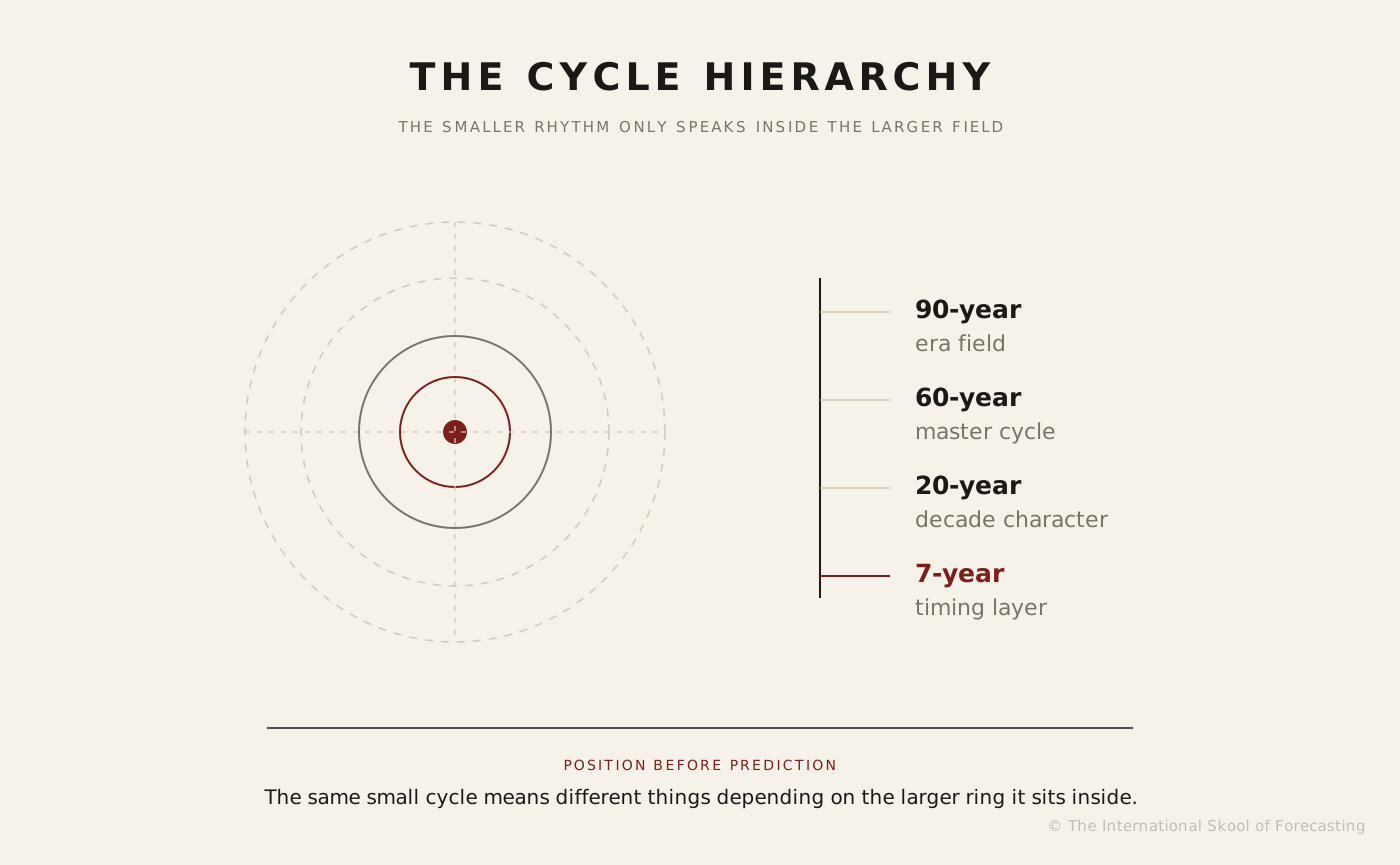
Think of the market as a set of orbits, not a single line. A large cycle is a planet. The smaller cycles inside it are moons. Far from the planet, a moon moves on its own. Close in, the planet's gravity bends its path. A cycle count that ignores the planet reads the moon as if it travelled alone.
The old source work knew the planets were there. The wheels-within-wheels image is our own shorthand for what the Gann literature gestures at and never sits down to explain. Walter Bressert and James Jones named the primary cycle and showed it was real. None of it hands you the part that matters most: which wheel holds authority right now, and how to tell when that authority is about to pass to a larger one. The literature assumes you already know. The reader who does not know is left counting moons.
Modern market education makes the same omission from the other side. Technical analysis teaches you to read price after it has moved. It does not teach you to read time before it moves. So even careful traders end up reacting, then fitting a cycle count to the move to explain it. The count looks like foresight. It was hindsight wearing a costume. A five-week rhythm can run bullish inside a primary cycle that is turning down, and the trader who reads only the small rhythm takes the cleanest-looking entry on the chart straight into the larger turn.
When a shorter cycle approaches the end of a longer cycle, the longer cycle can change the shorter cycle's timing. The course teaches you how to recognise that change.
The blind spot is one thing seen from four angles. Each one has a different feel on a live chart, and each one has cost a careful trader real money. You will recognise at least one as your own.
01
Curve-fitting
A cycle that fits the past is easy to draw. Slide the spacing a little and it will fit almost any chart behind you. That fit feels like proof. It is not. A count only earns trust if it keeps working on data it has never seen, and most counts are never tested forward at all.
02
One timeframe
A five-week cycle can be bullish inside a bearish primary cycle. Read one timeframe and you miss the rhythm that actually controls the move. The small wheel says buy. The large wheel says the buyers are about to be overrun. You took the trade the small wheel approved and lost on the one you never looked at.
03
The fixed date
Cycles invert, expand and contract. Treat a count as a fixed calendar date and you defend it long after the market structure has changed. The date arrives, the turn does not, and you keep waiting because the number on the page feels certain. A count is a window with an orb, not an appointment.
04
No dominance check
Without a way to tell which cycle is in control, every count carries equal weight. A reliable pattern then fails and you cannot say why. You file it under bad luck and draw the next count the same way. The failure was not luck. A bigger wheel took control and nothing in your method was watching for it.
A working reading needs four things, in order. A cycle you can measure. A primary rhythm to anchor on. A hierarchy that shows which wheel dominates. And a review that tells you when a count has failed. Miss any one and the other three still let you down — which is why the order matters more than any single piece of it.
§ The method — built in six layers
The method has a clear order. Each step ranks the cycles before the next step is used.
You can find the parts scattered across old books. What no source gives you is the sequence: how dominance ranks the hierarchy, and how to read a cycle when a larger one is bending it.
In 2011 I lost more than $50,000 in silver. My charts were right. My timeframe was wrong, and I had no way to know it.
The setup looked clean. The price action was bullish. I bought with confidence. Inside 48 hours the position was gone. What I had not seen was that silver was at a multi-year cycle peak. I was reading a small wheel and ignoring the large one turning against it.
The loss did not feel like a market problem. It felt like a hole in how I read time. I had a count. The count was correct. It explained the lows behind me and the rhythm I had bought into. And it was useless, because a longer cycle had reached the point where it overrides everything inside it. My method had no way to see that the override was coming. It treated the small wheel and the large wheel as equal voices, and the small one was louder.
The loss sent me back to the source work: Gann, Bressert and Jones, the old cycle literature. I read it differently the second time. I stopped looking for a better count and started looking for the thing the books never quite say out loud. The fix was not a sharper line on the chart. It was a way to rank the counts, so the dominant rhythm shows itself before the smaller ones mislead you. The layers below are that ranking, in order.
1
What a cycle actually is
First, the basics done properly. How to measure a cycle low to low. How to add an orb so a count is a window, not a fixed date. How translation, right or left, reads as background strength or weakness. This is the layer most traders rush. They draw a count, it fits, they move on. Done loosely, every layer above it inherits the slack. Done properly, you can already say why a clean rhythm is clean and a forced one is not.
A real cycle has to keep working after it is identified. It has to explain prior turns and survive the next ones.
2
The primary cycle, your anchor
Next, the central rhythm. In most stock indices the primary cycle runs roughly 13 to 21 weeks. Walter Bressert and James Jones set that band out in 1984, and Raymond Merriman — who apprenticed under Bressert — publishes the same figures. It is long enough to hold a full psychological swing, low to high to low, and short enough to give regular turns through the year. Everything else is read against it. Without an anchor, a hierarchy is just a stack of lines with no order. The primary cycle is the line the rest of the method takes its bearing from. Pick the wrong anchor and every reading above it tilts.
3
The principle of dominancy
This is the layer that fixes the blind spot. The first two major cycles inside a primary cycle run with textbook regularity. They sit far enough from the primary's completion to express their own rhythm cleanly. As the third nears the primary's completion, the larger cycle's gravity warps the smaller ones. This is why a reliable pattern suddenly fails: a bigger wheel took control. Once you can see that handover coming, the failures stop being mysteries. You learn to recognise the moment a smaller rhythm is about to lose authority, before the price action makes it obvious to everyone else.
A dominance cycle is static. The principle of dominancy is dynamic — it explains why smaller cycles warp as a larger one nears completion.
4
The hierarchy, read in three dimensions
Now the wheels stack. Short, medium and long cycles run at once. You stop seeing a flat line and start seeing depth: a daily rhythm inside a primary cycle inside a multi-year wave. You learn to rank them and name the one with authority right now. This is the difference between a trader who watches one timeframe and a researcher who reads the whole structure. The single-timeframe habit is what lets the larger wheel ambush you. Reading in three dimensions, you see the ambush forming because you are watching the wheel that sets it.
5
Reading age, translation and confluence
A cycle behaves differently young than late. You learn to read its age, to tell a major correction from a true reversal by objective rule, and to spot real confluence: independent rhythms arriving in the same window, not a pile of unrelated reasons. The distinction matters because the costliest errors live here. Mistake a correction for a reversal and you exit a trade that had further to run. Mistake forced agreement for confluence and you trust a window that was never really there. Real confluence is earned. It is when the daily rhythm, the primary cycle and a longer wave point at the same time band on their own.
Confluence means that independent timing structures identify the same window. If a count only fits after repeated adjustments, it is not evidence.
6
The review that keeps the method honest
Last, the discipline most traders skip. After a window passes, you ask whether the turn came, whether the cycle inverted, whether it ran early or late. This review is what separates a living method from decoration on a chart. It is also what fades a count before it costs you. A method without review hardens into superstition. The count that once worked gets defended past the point where the market has moved on. Review keeps the reading honest. It is the habit that turns a set of ideas into a skill you can trust under pressure.
The hierarchy at a glance — which wheel is in control, and when a larger one takes over.
§ The proof walk
The course uses three study cases: an equity, a cryptocurrency, and an Indian index.
These are worked study cases on closed historical data, not signal calls, and not forecasts of anything ahead. Each one is located low to low, projected forward, and open to being wrong. One of them was.
Read them with the questions a sceptic would ask. Could the count have been drawn to fit the past after the fact? Does the same rhythm hold across markets that share no story with each other? An equity, a crypto and an index have nothing in common except that traders move them. If one method ranks the wheels in all three, the method is reading something real about time, not something special about one chart. That is what these cases are here to test.
Telstra
A larger wheel · 90 months
A 90-month count lands on Telstra's low once — and misses the next test outright.
Say the awkward part first: this count was drawn backwards. I did not publish it in 2010 and then wait. It is measured from a low already in the record, then walked forward against what the chart went on to do. That is a demonstration of the method, not evidence of foresight, and anyone who tells you otherwise is selling you the wrong thing.
Now the arithmetic. Ninety months is one quarter of the way around the circle. Telstra's all-time low is $2.55, printed on 17 November 2010. Count forward ninety months and you arrive in May 2018. Telstra printed a seven-year low that quarter — the actual low came in June. Inside a one-month orb. Call it a hit.
Count forward another ninety months and you arrive in November 2025. Telstra was making eight-year highs. A miss, and not a near one.
One hit, one miss, on the only two tests the record allows — and with under thirty years of price history, the 90-month window has not yet completed a single full circle. So it is not a proven cycle and I will not present it as one. I could have left the second test out of this letter and you would never have known. It is in the course because the honest version is the one worth learning from: a large wheel sets the schedule the smaller rhythms are read against, and you keep the record of whether it delivered, both ways.
Bitcoin
Three intervals · 2011–2022
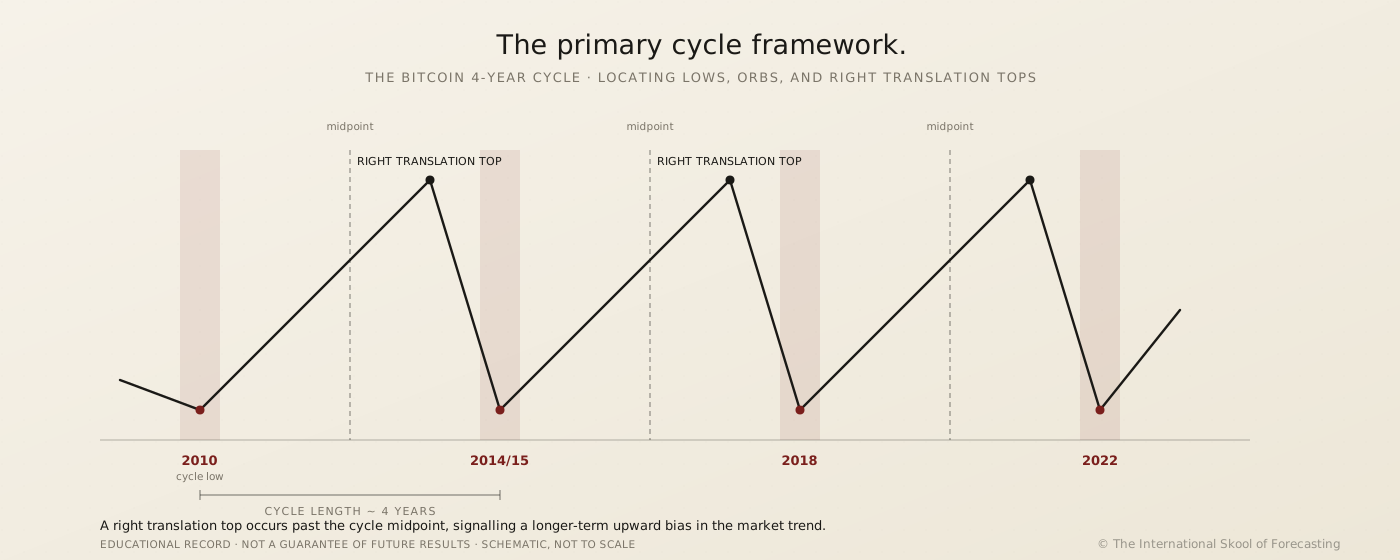
Bitcoin’s lows are 38, 47 and 47 months apart — and the halvings have never once been four years.
The major lows fall November 2011, January 2015, December 2018 and November 2022. Spacings of 38, 47 and 47 months. That is three completed intervals, not four — and the first is nowhere near four years.
Now the part almost nobody checks. The halvings are supposed to be the metronome behind the famous four-year cycle. They run 3.61, 3.84 and 3.94 years apart. Not one of them is four years — and the schedule has no way to make one, because it counts blocks mined, not calendar time. The "four-year cycle" everyone repeats is a rounding error with a following.
So both halves of the popular claim fail an afternoon's arithmetic. What survives is smaller and truer: a long wheel that has run 38, 47 and 47 months, and a method for ranking it against the shorter rhythms inside it. Note too where your chart starts. The beginning of a price feed is not a cycle low, and anchoring a count to it because it is the leftmost bar is exactly the curve-fit this module exists to teach you to refuse.
Nifty 50
Cold start · No prior view
The same steps located the primary cycle in an index never studied before.
The Nifty 50 is run as a search, on purpose. The lesson is titled "seek and ye shall find" — which is a warning, not a promise. Look hard enough at any chart and you will find a cycle. The lesson is watching what it takes to decide whether the thing you found is real or whether you talked yourself into it.
Here is why that case earns its place. A method that only works on markets you already know is not a method. It is a memory. So the primary cycle is located low to low on unfamiliar ground, ranked against the larger wheel, and read forward — and you see the false starts, not just the tidy finish. The reading transfers because the principle of dominancy does not belong to one chart.
We want to be free thinkers. We want to locate the cycle ourselves, without anyone coming in to show us what to do.
Cycle work without dominancy
You draw counts and hope the chart agrees.
One cycle, fitted to the past
A single timeframe read alone
A calendar date held as fixed
Every count weighted the same
No way to explain a failure
Cycle work with dominancy
You rank the wheels and read the one in control.
Counts tested forward, not just back
Short, medium and long read together
A time window with an orb
The dominant rhythm named first
A review that fades a dead count
Proof Walkthrough Video
Optional: instructor walking through the historical backtest on screen.
AUD $2,997 · One payment · Lifetime access · NDA and ID verification on enrolment
§ See inside
One complete cycle analysis, from the chart to the final test.
A short chart walkthrough: locating the primary cycle low to low, adding the orb, and ranking it against the larger wheel. This is the everyday work of the course, not a highlight reel.
Method plate — The Bitcoin 4-Year Cycle. The cycle length, orb, and translation are taught inside the course.
A cycle that only fits the past is curve-fitting. The course shows you how to test that risk.
It is the fair objection. Anyone can draw a low-to-low count that fits the chart behind them. Crypto, equities and commodities all look different. So why trust a count to hold on the right edge, where the money is?
The common mistake is to find a cycle that fits the past and assume it will control the future. That is curve-fitting.
The method answers it with two moves. First, dominancy: a count is not weighted on its own, it is ranked against the larger wheel that can override it. Second, review: every window is checked after it passes. A count that inverts, runs early, or fails gets faded, not defended. The fit to the past is only the start. The count earns trust by surviving the next turns and by behaving the way the hierarchy predicts.
Notice what those two moves do to the curve-fitting trap. Curve-fitting is what happens when a count answers only to the past. It has no second voice. The principle of dominancy gives the count a second voice it cannot argue with: the larger wheel either confirms the reading or overrides it. Review gives it a third: the record of whether the window actually delivered. A fitted count fails all three the moment it meets new data. A count that has been ranked and reviewed is no longer a flattering line drawn over old prices. It is a reading that has been forced to defend itself, turn after turn.
A cycle must continue to work after it is identified. If it only fits after repeated adjustments, it is not evidence.
That is why the Nifty 50 is worked as an open search — the lesson is called "seek and ye shall find," and watching the search is the lesson. The market changes. The discipline does not. You read the dominant rhythm, mark the window, watch price into it, and review what happened.
§ Why now
Every market has a dominant cycle. The course teaches you how to identify it.
The reason to start now is the practice you miss while deciding. The method does not expire, but a market window passes whether you have learned the review process or not.
The primary cycle runs roughly 13 to 21 weeks. In a single year that is three to four turns in every index, every commodity, every crypto chart you follow. Each turn is a chance to read which wheel is in control, or to guess.
Wait a year and you have read a dozen turns without the ranking. That is a dozen windows where you saw price move and could only explain it afterward. The course price is fixed and one-time. The reading you skip is not.
There is a quieter cost too. Each turn you read blind teaches the wrong habit. You fit a count to what already happened, it feels like understanding, and the habit hardens. The longer you wait, the more turns you spend reinforcing the reaction you are trying to replace. The skill compounds in the other direction. Start now and every window becomes practice. The same turns that are costing you become the cases you learn from.
§ Why this is gated
The course teaches a reusable skill instead of sending trade alerts.
Cycle work copied without its context becomes a slogan. Someone screenshots a low-to-low count, posts it as a secret, and a careful method turns into forum noise. The reader who paid for the judgement loses the thing they paid for.
You are buying a skill, not a subscription. Once you can find the dominant cycle on a blank chart, no one needs to find it for you again. The spreadsheet and the scripts speed the work up. The reading is yours for the rest of your career.
That is also why the teaching is done over the shoulder, not in slides. You do not watch a theory and then go practise alone. You watch the reading happen on real charts: a weak count rejected, a clean one kept, a window built only when the evidence earns it. The judgement is the part that cannot be copied off a screenshot, and it is the part you are paying to absorb. A slogan can be lifted in a sentence. A way of seeing has to be shown, then practised, then reviewed.
Verification is plain. You sign an NDA covering no redistribution, no public teaching, and no resale. You submit a photo of your face beside your government photo ID through a secure portal, and a person reviews it by hand before access is released.
The material is not distributed anonymously. Every student in this program has been verified. You will be too.
The refund clause: If for any reason we cannot verify your identity, no access is released and we work with you directly to resolve it. No change-of-mind refunds once access is released — once verified, the course is in your hands permanently, and we treat that transfer as final. This does not limit your rights under the Australian Consumer Law. The verification gate is the only point at which money moves backwards.
§ Ten modules, six stages — what you build
Ten modules taught in six stages. You finish with a repeatable chart-reading process.
The course itself runs ten modules, fifty-seven lessons. This letter walks them as six stages, because that is how the capability actually builds: fundamentals, the primary cycle, dominancy, hierarchy, the worked cases, then the working desk. Each stage folds in more than one module behind the scenes — the full ten-module breakdown is on the enrolment page. You do not watch six lectures. You build one capability.
The instructor · how this course came to exist
What I am not claiming.
I did not invent cycle analysis and I will not pretend to. Bressert and Jones did the measuring work. Merriman published the cycle lengths you will start from, and they are credited to him inside the course, not dressed up as mine. Two of the four tools on the desk are other people's software that you license yourself. Strip all that out and what is left is the part I actually built: the order. Which wheel you read first, how you rank the rest against it, how you recognise the handover before the price action announces it, and how you fade a count that has stopped working.
That order is what I went looking for in 2011 and could not find in any book. I spent the years since assembling it from the source work and testing it on live markets until it held — including the tests it did not pass, which are in here too. It is not magic. It is a sequence, written down, in the order it has to be done.
Stage 1
Cycle fundamentals — your measuring eye
You learn to measure a cycle low to low, add an orb so the count is a window, and read translation as background strength or weakness. By the end you can mark a clean rhythm and say why it is clean. This is the input every later module uses.
Definition, measurement and orb
Right and left translation, read on chart
Trend character and conflicting patterns
Stage 2
The primary cycle — your anchor rhythm
You set the central cycle that everything is read against. In most stock indices it runs roughly 13 to 21 weeks. You learn its bull-market architecture: the phases of advance and consolidation, and why the first phase shows powerful right translation. This is the rhythm you trade around.
The 13–21 week primary cycle
Bull-market phase structure
The principle of dominancy, introduced
Stage 3
Cycle hierarchy — the market in three dimensions
You stop seeing a flat line. Short, medium and long cycles run at once, and you learn to rank them. The principle of dominancy is the heart of this module: why the first two major cycles run cleanly, and why the third warps as the primary nears completion. This is the layer that ends the surprises.
Short, medium and long rhythms ranked
The orbital model of dominancy
Why reliable patterns suddenly fail
Stage 4
Validation and review — telling real from fitted · Modules 4 and 5
This is where the curve-fitting objection gets answered in practice, and it takes two modules. Module 4 hands you the objective rule that separates a major correction from a true reversal. Module 5 hands you the working discipline that runs after a window passes — the implementation checklist, the Trade Quality Scorecard, the review itself. A count that inverts or fails gets faded there, not defended.
Module 4 · reversal vs. correction, by objective rule
Module 5 · the implementation checklist and Trade Quality Scorecard
Module 5 · the post-window review that fades a dead count
Stage 5
Practical case studies — the method on live charts
You watch the reading done over the shoulder, on real markets. Bitcoin's low-to-low spacings, Telstra's 90-month projection — one hit and one miss — and the Nifty 50 worked as a search rather than a demonstration. You see weak counts rejected, clean ones kept, and a window built only when the evidence earns it. The judgement is the product.
Bitcoin — the four-year cycle
Telstra — the 90-month wheel
Nifty 50 — cold-start discovery
Stage 6
The working desk — your tools for life
The reading becomes a daily desk. You build your own TradingView scripts in the Pine editor, run the Optuma periodogram and Timing Solution’s spectrum tools, and work from a cycle-length spreadsheet seeded with Merriman’s published mean cycle lengths, credited to him. The tools do not replace the judgement. They make it visible on the chart.
Cycle-length spreadsheet · candidate periods
Pine editor scripts · the Optuma periodogram · Timing Solution
Protected delivery: post-NDA and identity verification
Say the awkward part first. Two of the four tools — Optuma and Timing Solution — are commercial packages you license yourself, by the year, for as long as you keep using them. This course does not replace that cost and does not pretend to. What it gives you is what to do with what they show youRented yearly
The cycle-length spreadsheet, and the TradingView scripts you write yourself in the Pine editor — yours, because you built them, with nothing to renewYours for life
A starting set of published mean cycle lengths — Merriman's, credited to him, not claimed as original research — so you begin from a reference point instead of a blank chartIncluded
Ten modules, fifty-seven lessons, and three worked cases — one of which fails, and is taught as a failureIncluded
The trade is plain. Rent your tools by the year, forever, and still guess which wheel is in control — or own the reading once, and never rent that part againOne payment, for life
You pay — once, lifetime accessAUD $2,997
Enrol — AUD $2,997 →Identity check and NDA required before access is released · no change-of-mind refunds, which does not limit your rights under the Australian Consumer Law.
§ What you walk away with
You begin marking cycles in Module 1.
There are no change-of-mind refunds once access is released, which does not limit your rights under the Australian Consumer Law. So the specificity is the guarantee. Here is exactly what you can do at each milestone, and you can hold me to every line of it.
By Module 1
Mark a clean cycle low to low.
You can measure a rhythm, add an orb, and read its translation. You can say why a count is clean and when it is not.
By Module 3
Name the wheel that is in control.
You can rank short, medium and long cycles, and read dominancy. You know why a reliable pattern warps as a larger cycle completes.
By Module 6
Read the primary cycle on any chart.
Four lessons build the desk: the cycle-length spreadsheet, your own Pine editor scripts, the Optuma periodogram, and Timing Solution's spectrum tools — cross-checking each other on a market you have never seen.
After enrolment · Yours forever
Lifetime access — including every future refinement.
All current materials, all updates added over time, all future refinements as they are produced. No subscription. No renewal. No re-purchase. Once you are verified and the NDA is on file, the course is yours for the rest of your career.
§ Two more from the desk
Review the course cases before you decide.
No student quotes here. This is a study course, so the proof should be work you can check rather than praise you have to accept. These are the course's own cycle cases: Bitcoin shows why a simple four-year explanation is incomplete, while Telstra shows a count that worked once and then failed its next test.
Bitcoin's major lows arrived 38, 47, and 47 months apart. The halvings that supposedly explain them ran 3.61, 3.84, and 3.94 years. The course uses the actual intervals rather than rounding them into a simple four-year story.
Bitcoin — three recorded lows
Course study case
A 90-month count landed on a Telstra low once, then missed the next test outright. The course keeps the miss in the record. A cycle count is useful only when it survives new data.
Telstra — 90-month count
Course study case · one miss included
§ Enrolment — three steps, operational
What happens after you enrol.
1
Enrol
Complete checkout via the secure page. Your enrolment immediately enters manual review. You will receive a confirmation.
2
Verify
NDA and identity verification protect the student files and the research process. Access is released after verification is complete. If verification cannot be approved, no access is released and we work with you directly to resolve it.
3
Read
Open Module 1 — six lessons — and start measuring cycles on your own charts. Load the cycle-length spreadsheet, seeded with Merriman's published figures, and generate your first candidate periods. By the end of the first week you are reading the primary cycle, not watching lessons about it.
§ Objections — including the one I answer against myself
Eight questions. One makes me list everything I did not invent.
Do I need to know cycle theory before I start?
No. Module 1 starts from the definition of a cycle: how to measure it, add an orb, and read translation. If you can read a price chart, you have enough. The order of the modules builds the rest.
Gann and Bressert are in old books. Why pay for this?
The books name the primary cycle. They do not teach the selection. They assume you already know which cycle matters. This course teaches the ranking the sources skip: dominancy in Module 3, and the implementation checklist and post-window review that fade a dead count in Module 5.
Does cycle work still hold in today's markets?
The discipline holds; the market changes. Modules 7 through 10 run the method on live charts — Bitcoin in Module 7, Telstra in Module 9, and the Nifty 50 capstone in Module 10, worked as an open search rather than a tidy demonstration. If the steps only worked on markets you already knew, they would not be a method.
What if I just curve-fit a count that then fails?
Two modules exist to catch exactly that, and it is worth knowing which does what. Module 4 gives you the objective rule for telling a major reversal from ordinary market noise. Module 5 gives you the implementation checklist and the Trade Quality Scorecard — the post-window review that tells you when a count has inverted, run early, or failed. A count earns trust by surviving the next turns, not by fitting the last ones.
The deeper guard against curve-fitting is dominancy itself, taught in Module 3. A fitted count answers only to the past. Rank it against the larger wheel and it now has to answer to a force you did not draw. Either the larger cycle confirms the reading or it overrides it. A count that survives that test is not a flattering line. It is a reading that has been argued with and held.
Is this a signal service or an alert room?
No. There are no buy or sell alerts. This is the build, not the service. You learn to read the wheels yourself, the way you learn to read a chart rather than wait for someone to read it for you.
I trade crypto, not indices. Is this for me?
Yes, if the market has enough history. The principle does not belong to one asset. The worked cases span Bitcoin, an equity, and an index on purpose. The reading transfers; only the cycle lengths change.
What is actually original here?
Two things, and I will name the limits of both. The sequence that ranks cycles by dominancy rather than treating them as equal weight, taught in Module 3. And the working desk in Module 6 — the cycle-length spreadsheet that generates candidate periods, plus the TradingView scripts you write yourself in the Pine editor to plot them. The Optuma periodogram and Timing Solution are third-party tools taught in that same module; I did not build those and do not sell them.
The parts are not secret. The Gann literature circles the idea of nested wheels. Bressert and Jones named the primary cycle. What no source publishes is the order: how to rank the wheels, how to read the handover when a larger one takes control, and how to fade a count that has failed. That order is the work. It is the difference between owning the ingredients and being able to cook.
How long until I can read a chart on my own?
You are measuring cycles in week one — Module 1 is six lessons and starts from the definition. The reading sharpens across the worked cases in Modules 7 to 10. Fifty-seven lessons in total, self-paced, and the working tools are yours for life, so you return to them as new turns appear in your markets.
§ Who this is not for
Four kinds of reader will be better served somewhere else.
If you want a signal service.
There are no alerts here, and there will not be. This is the reading, taught to you. If you want someone to tell you when to buy, a signal room will suit you better.
If you want a push-button indicator.
The spreadsheet generates candidate periods. The periodogram ranks them. Neither makes the call. The judgement is yours, and a reader who wants the tool to decide will be frustrated by a course that teaches the decision.
If you will not study and review.
The capability lives in the charts you read and the windows you review, not in the videos you watch. Skip the work and you keep theory, not skill. There are no change-of-mind refunds once access is released — that does not limit your rights under the Australian Consumer Law, but it does mean the cost of not doing the work is yours.
If you need certainty before you act.
This is education, not financial advice, and no forecast removes risk. The method maps a time window and tests it. If you need a guarantee before you move, no honest cycle work will give you one.
If you want to read the wheels yourself and keep that reading for life:
Ten modules, fifty-seven lessons, walked here in six stages. The worked cases on real charts, the cycle-length spreadsheet, the scripts you write yourself, and Merriman's published cycle lengths as your starting reference. You learn the ranking once and apply it to any market with enough history. That is the course.
§ The decision
Three to four turns a year, in every market you watch
After the course, you can identify which cycle is controlling the chart.
You stop seeing the market as a flat line and start seeing its structure in three dimensions — the great tides and the small waves, one system.
The second case is the one that costs money. The primary cycle runs 13 to 21 weeks. That is three to four turns a year, in every market you follow, whether or not you have a way to rank them. Wait twelve months and you will have read a dozen windows blind — and worse, you will have spent twelve months practising the habit of fitting a count to a move after the move, which feels like understanding and is not. The price of this course is fixed and paid once. The turns are neither.
The third case is the mechanics. Here is precisely what you are buying:
Ten modules · fifty-seven lessons
The principle of dominancy
The cycle hierarchy, ranked
Three worked cases · one of them a miss
TradingView scripts you write yourself
Merriman's published cycle lengths, credited
Future refinements included
Lifetime access after verification
AUD $2,997
One payment · Lifetime access · NDA + identity verification
Enrolment process — After payment, complete a two-minute identity check via Stripe (government ID + selfie) and sign a non-disclosure agreement. Course access is issued after both are reviewed.
Identity check and NDA required before access is released · no change-of-mind refunds, which does not limit your rights under the Australian Consumer Law.
Educational content only. Not financial advice. All markets carry substantial risk, and past results do not guarantee future outcomes. Cycle work identifies time windows; it does not name a specific date and does not remove risk. NDA and identity verification are required on enrolment. No change-of-mind refunds once access is released. This does not limit your rights under the Australian Consumer Law. Consult a qualified financial professional before any investment decision.
P.S. — If you read nothing else on this page, read the arithmetic. Everyone knows Bitcoin has a four-year cycle. The lows sit 38, 47 and 47 months apart, and the halvings that supposedly drive them run 3.61, 3.84 and 3.94 years — never once four. The most repeated cycle claim in modern markets is a rounding error, and it takes an afternoon and a calendar to prove it. That is the standard of checking Wheels Within Wheels teaches, across ten modules and fifty-seven lessons, for AUD $2,997 once, with lifetime access after verification. AUD $2,997 — Enrol now →
P.P.S. — In 2011 a clean setup and a correct count still cost me more than $50,000, because a larger wheel was in control and nothing in my method was watching for it. This course is the ranking I went looking for that week and could not find in any book. It also contains a projection that failed — Telstra's second 90-month test, November 2025 — taught as a failure, because a course that only shows you winners is not teaching you to check anything.
P.P.P.S. — The price is fixed and paid once. The turns are not. The primary cycle runs 13 to 21 weeks, which is three to four windows a year in every market you follow, starting with the one turning right now. If you will not study the charts and review the windows, do not enrol — there are no change-of-mind refunds once access is released, which does not limit your rights under the Australian Consumer Law. If you will do the work, you walk away able to read the wheels yourself, for the rest of your career.
Wheels Within WheelsAUD $2,997 · Lifetime access · NDA and ID verification on enrolment