Wheels Within Wheels · Level 1

Your cycle fit the past and still lost money. A larger wheel was in control.

Ten modules, fifty-seven lessons on dominancy: how to identify the dominant rhythm, rank nested cycles, and recognise when a larger one is taking control. The work is demonstrated through study cases on Bitcoin's four-year cycle, Telstra's 90-month wheel, and the Nifty 50 — including a projection that failed.

One payment · Lifetime access · NDA + identity verification

38 · 47 · 47 Months between Bitcoin's lows
3.61 · 3.84 · 3.94 Years between halvings — never 4
13–21 weeks The primary cycle
1 hit · 1 miss Telstra's 90-month count
Open now Annual intake
§ Proof · Worked cases, not slogans

One hit, one miss, and one open search. Every number below is checkable in an afternoon.

This course teaches a method, so the proof is worked cases, not testimonials. Say the awkward part first: these counts were drawn backwards. Each one is measured from lows already in the record, then walked forward against what the chart went on to do. That demonstrates the method. It is not evidence of foresight, and I will not dress it up as any. They are closed historical studies — not signal calls, and not forecasts of anything ahead.

Before you read them, you should know where they came from, because it is not flattering. In 2011 I was long silver on a count I had checked three times. Inside 48 hours I was down more than $50,000. The count was not wrong — it was junior, a multi-year wheel was turning against it, and nothing in my method could rank the two. This course is the ranking I went looking for that week and could not find in any book. It is also why the first case below carries a failed projection I could have quietly left out, and you would never have known. I teach the miss. A method that only ever shows you winners is not teaching you to check anything.

Telstra’s all-time low is $2.55, printed on 17 November 2010. Count forward 90 months and you land in May 2018 — a seven-year low, with the actual low in June. One clean hit, inside a one-month orb. Count forward another 90 months and you land in November 2025, where the projection failed outright: Telstra was making eight-year highs. One hit, one miss, on a stock with under thirty years of history — which means the 90-month wheel has not yet completed a single full circle. It is not proof of a repeating cycle, and I do not present it as one. It is the honest record of a large wheel setting the schedule the smaller rhythms are read against, and the course teaches both halves.

Jonathan Evans
Telstra — the 90-month wheel
Worked case · Course study

Bitcoin’s major lows fall in November 2011, January 2015, December 2018 and November 2022 — spacings of 38, 47 and 47 months. That is three completed intervals, not a proven cycle, and the first one is nowhere near four years. Here is the part almost nobody checks: the halvings themselves have never been four years apart either. They run 3.61, 3.84 and 3.94 years, because the schedule is counted in blocks rather than calendar time. The popular "four-year cycle" is a rounding error people repeat. Which is exactly the point. Once the headline number dissolves, you still need to know what the long wheel is doing and whether it outranks the shorter rhythms inside it — and that ranking is the course. The count is the easy half. Knowing which one holds authority is the half nobody sells you.

Jonathan Evans
Bitcoin — the four-year cycle
Worked case · Course study
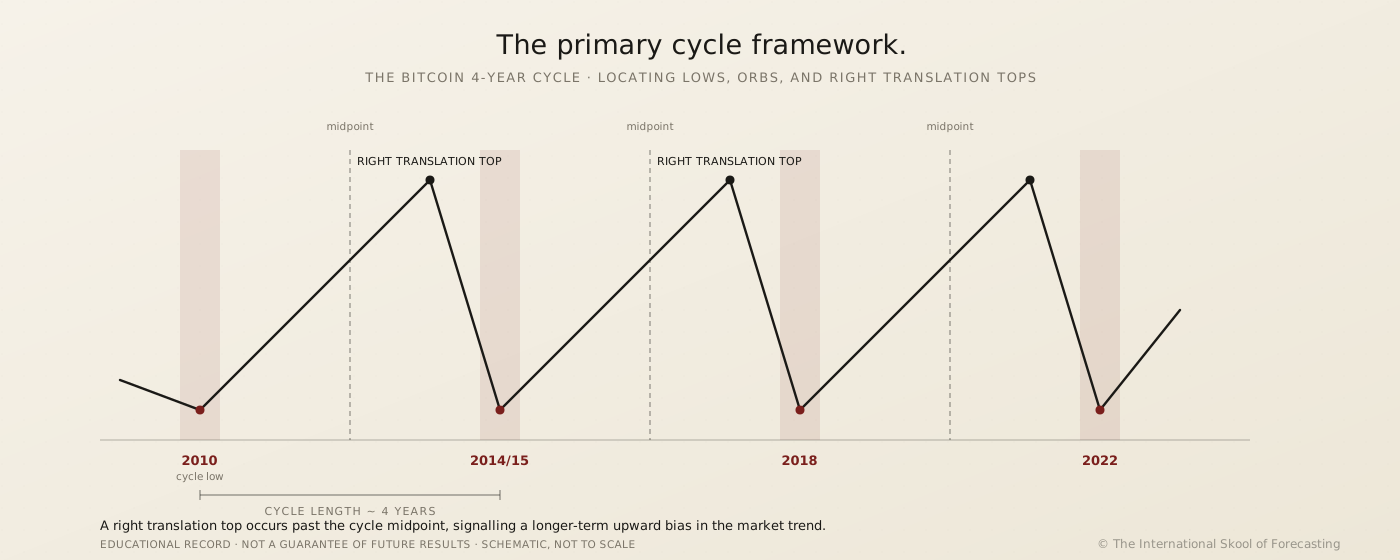
Schematic of Bitcoin's 4-year cycle: lows in 2010, 2014/15, 2018 and 2022, with right translation tops occurring past each cycle's midpoint
Low to low → midpoint → right translation top → next low. The same four steps, applied to the arithmetic above.

You are thinking you could count those spacings yourself this afternoon. You could. Arithmetic is free. What is not free is the ranking — knowing which of those wheels holds authority right now, and when the larger one is about to overrun the smaller. That judgement is the whole of what $2,997 buys.

The Nifty 50 is worked as a search rather than a demonstration — the lesson is called "seek and ye shall find," which is the honest name for it. You watch the method hunt for a cycle in an unfamiliar index, and you watch what it takes to decide whether what turns up is real or wishful. That is more useful than a clean result. You learn it once and read any chart that has enough history.

Jonathan Evans
Nifty 50 — seek and ye shall find
Worked case · Course study
§ Why now · The cost of waiting one more cycle

Three to four turns a year, in every market you follow.
You will read every one of them — ranked, or blind.

The primary cycle runs roughly 13 to 21 weeks — Bressert and Jones set that band out in 1984, and Merriman, who apprenticed under Bressert, publishes the same figures. Three to four turns a year, every year, in every market you watch. Wait twelve months and you have read a dozen turns without knowing which wheel was in control. Here is the part that compounds against you: each one teaches the wrong habit. You fit the count afterwards, it feels like understanding, and the habit hardens. The method does not expire. The turns do not come back.

A 5-week cycle can look bullish inside a bearish primary cycle. The trader who cannot tell the difference enters the best-looking trade and gets stopped out before the larger rhythm pays.
Turns per year, per market 3–4
Primary cycle length 13–21 wks
Intake Open now
Access term Lifetime
§ Velvet rope · Why this is gated

The course is gated to protect the method and its context.

Cycle work copied without its context becomes a meme. Someone screenshots a low-to-low count, posts it as a "secret," and a careful method turns into a slogan. The reader who paid to learn the judgement loses the thing they paid for: a method other people respect, not one they have seen ten times on a forum.

You are buying a skill, not a subscription. Once you can find the dominant cycle on a blank chart, no one needs to find it for you again. The cycle-length spreadsheet, seeded with Merriman's published mean cycle lengths, makes the work faster, but the reading is yours. That stays with you for the rest of your career.

Verification is plain. You sign an NDA that covers no redistribution, no public teaching, and no resale. You submit a photo of your face beside your government photo ID through a secure portal. Sensitive numbers may be redacted; we check your name, photo, and address. A person reviews each submission by hand, and access is released after approval.

The refund clause: If for any reason we cannot verify your identity, no access is released and we work with you directly to resolve it. No change-of-mind refunds once access is released. This does not limit your rights under the Australian Consumer Law. The verification gate is the only point at which money moves backwards.

§ The offer · What you build · What you pay

Ten modules. Fifty-seven lessons. A cycle-reading process you can reuse.

Each module adds one layer to the reading. You start with what a cycle is, then dominance, hierarchy, validation, the working desk, and four modules of worked cases. By the end you can find the primary cycle on a chart you have never seen.

  • Module 1 — Seeing the Market's Hidden Clock · What a cycle is and how to define it
  • Module 2 — Measuring Cycles and Reading Translation · Precise measurement and trend psychology
  • Module 3 — Anchoring on the Primary Cycle · The hierarchy of market time and the principle of dominancy
  • Module 4 — Reading Bull and Bear Cycle Anatomy · Timing entries and spotting real reversals
  • Module 5 — Building Your Cycle Trading Plan · The implementation checklist, the Trade Quality Scorecard and the post-window review
  • Module 6 — Your Cycle-Hunting Toolkit · Spreadsheet, Pine editor, Optuma and Timing Solution
  • Module 7 — Proving Cycles on Bitcoin · The four-year cycle claim, tested from a blank chart
  • Module 8 — Finding Cycle Lengths Everywhere · Merriman's published cycle lengths across markets
  • Module 9 — From Cycle Models to a Working Framework · The full framework built on Telstra
  • Module 10 — The Nifty50 and LIT Capstone Studies · Testing a cycle model on unfamiliar ground

Somewhere in that list you were waiting for me to tell you what to buy. There are no signals here and never will be. You are buying the reading, and the reading is only worth anything once it is yours.

Say the awkward part first. Two of the four tools — Optuma and Timing Solution — are commercial packages you license yourself, by the year, for as long as you keep using them. This course does not replace that cost and does not pretend to. What it gives you is what to do with what they show you Rented yearly
The cycle-length spreadsheet and the TradingView scripts you build in the Pine editor — yours, because you wrote them Yours for life
A starting set of published mean cycle lengths — Merriman’s, credited to him — so you begin from a reference point rather than a blank chart Included
Ten modules, fifty-seven lessons, and three worked cases — one of which fails, and is taught as a failure Included
The trade is plain. Rent your tools by the year, forever, and still guess which wheel is in control — or own the reading once, and never rent that part again One payment, for life
You pay — once, lifetime access AUD $2,997

Enrolment
AUD $2,997
One payment · Lifetime access

  • Ten modules · fifty-seven lessons
  • Cycle-length spreadsheet, seeded with Merriman's published mean cycle lengths
  • Course updates included
  • Lifetime access after verification
Enrol — AUD $2,997
Identity check and NDA required before access is released · no change-of-mind refunds, which does not limit your rights under the Australian Consumer Law.
§ The objections · Asked and answered before you spend a dollar

Seven fair criticisms of this course. Answered plainly, before checkout.

A page that only tells you what is strong about a method is an advertisement. These are the questions serious people actually ask.

"Cycle counting is free — why pay $2,997 for it?"

Counting a low to a low is free, and you can do it in a spreadsheet this afternoon. What is not free is judgement: telling a real cycle from a curve-fit, knowing when a smaller rhythm is about to be overrun by a larger one, and reading a chart you have never seen before without a result to fit it to. That is the skill this course builds, worked on real cases including one that misses. Free tools give you the arithmetic. This gives you the discipline to use it.

"Why do I need to hand over ID and sign an NDA to buy a course?"

Because the method degrades when it is copied without its context. A screenshot of a cycle count posted as a "secret" turns a careful reading into a slogan, and the people who paid to learn it lose the thing that made it worth paying for. Verification is plain: a photo ID check and an NDA covering no redistribution, no public teaching, no resale. Sensitive numbers can be redacted. A person reviews every submission by hand.

"Where are the live trade signals?"

There aren't any, and there won't be. This teaches you to find the dominant cycle yourself, on any chart, using worked historical cases as the training ground — not a feed of calls to follow. If you want to be told what to buy today, this is the wrong purchase, and I would rather say so now than after you have paid.

"Isn't this just astrology with extra steps?"

No. The course teaches cycle measurement, hierarchy, and validation on price history — Bitcoin, Telstra, the Nifty 50 — using tools like the Optuma periodogram, Timing Solution, and a spreadsheet you build yourself. What drives the underlying timing model is not published on this site, and it does not need to be for you to learn the reading skill.

"You'll show me the hits and quietly skip the misses."

The Telstra case in this course is one hit and one miss on the same 90-month count, taught as both. Bitcoin's own halving schedule is presented as proof the popular "four-year cycle" is a rounding error, not a clean win. If a method only ever showed winners, it would not be worth the price of admission.

"The course teaches Optuma and Timing Solution — don't I have to keep paying for those too?"

Yes, and it would be dishonest to pretend otherwise. Both are commercial packages licensed by the year, and this course does not replace that cost. What you own permanently is the method and the spreadsheet and scripts you build yourself — the judgement, not the software.

"What if I pay and then can't get verified?"

If we cannot verify your identity, no access is released, and we work with you directly to resolve it before anything else happens. Once access is released and verified, there are no change-of-mind refunds — that does not limit your rights under the Australian Consumer Law.

§ Do not enrol if

Four kinds of trader should keep their money. I would rather lose the sale than the correspondence.

You want live trade signals

There are none here, and there never will be. This teaches you to find the dominant cycle yourself. If you want somebody to tell you what to trade on Tuesday, this is not that course.

You won't complete identity verification

Access is gated behind an ID check and an NDA, reviewed by hand. If that step is a dealbreaker for you, save yourself the friction and don't enrol.

You only trade intraday timeframes

The primary cycle runs roughly 13 to 21 weeks. This is a swing and position-timing method, not a scalping tool, and it will frustrate you if that is not the timeframe you work in.

You want a fully automated system

There is a spreadsheet and Pine editor scripts to speed the work up, but the reading is a judgement skill you build over time, not a set-and-forget indicator.

§ The decision · Three to four turns a year

After the course, you can identify which cycle is controlling the market.

That is the first case for doing this, and it is the one that changes how you see a chart. You stop asking what the market is doing and start asking which wheel is asking the question.

The second case is the one that costs money. The primary cycle runs 13 to 21 weeks — three to four turns a year, in every market you follow, whether or not you can rank them. Wait twelve months and you will have read a dozen windows blind. Worse, you will have spent twelve months practising the habit of fitting a count to a move after the move, which feels like understanding and is not.

The third case is the mechanics. Ten modules, fifty-seven lessons. The principle of dominancy and the hierarchy that ranks it. Three worked cases on real charts, one of them a failure taught as a failure. The cycle-length spreadsheet, the Pine editor scripts you write yourself, and Merriman's published cycle lengths as your starting reference. Paid once. Yours after verification, including every refinement added later.

AUD $2,997
One payment · Lifetime access

Enrolment process — After payment, complete a two-minute identity check via Stripe (government ID + selfie) and sign a non-disclosure agreement. Course access is issued after both are reviewed.

Enrol — AUD $2,997

Identity check and NDA required before access is released · no change-of-mind refunds, which does not limit your rights under the Australian Consumer Law.