Financial Time Table
The long economic tide, corrected timetable work, and the foundation beneath the rest of the framework.
Study one method alone and you can produce one reading. Study five and you see where they disagree: a solar window may identify one week, a lunar reading another, while the long economic and dominant-cycle methods describe a different condition. No single course teaches you how to compare those results. This program does.
The Market Forecaster includes the five method courses in sequence, the annual-forecast workflow, the first year of applied desk research, the proprietary tools, member-only Gann studies, and lifetime access to future research. One enrolment gives you the complete program.
You receive the complete training library and one year of applied research.
The first year of The Forecaster is included. Complete-program students renew at the member rate.
The long economic tide, corrected timetable work, and the foundation beneath the rest of the framework.
Lunar market timing, financial mood, and monthly pressure work across nested time layers.
Solar motion, degree counts, seasonal geometry, eclipses, and reversal-window research.
Dominant rhythm, nested cycles, confluence, and the hierarchy of market timing.
Sepharial's world-cycle framework, geopolitical rhythm, and long-range environment study.
Gann’s full annual-forecast workflow — the look-back research, the cycle stack, the Mass Pressure Chart, and a finished year-ahead roadmap. The deepest standalone study; a AUD $9,997 course on its own, included here.
Video lessons on Truth of the Stock Tape and 45 Years in Wall Street, reserved for students inside the complete program.
One year of applied monthly research, proprietary tools, supporting source studies, and lifetime access to future discoveries connected to the program.
Total reflects only line items with a real, separately listed price. The member-only Gann studies and lifetime future access are included but carry no standalone price to add on top.
From the desk of Jonathan Evans — about 32 minutes, and worth reading in one sitting
In November 2019 the Dow was at a record high and nobody had heard of the virus. This desk put a low in March on the calendar anyway, and sent it to members — four months before the event. The Dow bottomed on 23 March 2020 at 18,591.93, about 37% below its February peak.
Here is the part that matters, and it is not the call.
That reading was not produced by one method. Several methods identified the same window. The skill this page is selling is the ability to compare their results when they disagree, record the disagreement before the outcome is known, and decide which evidence deserves more weight.
Each method course covers a different part of the timing problem: Gann's long-range financial timetable, McWhirter's monthly pressure work, solar-degree timing, dominant-cycle analysis, and Sepharial's world-cycle framework. The Market Forecaster teaches all five in sequence and includes the first year of The Forecaster, where you watch them applied across six markets.
One course teaches one method. This program teaches the complete sequence and shows how the methods are used together in current conditions.
I want to be plain about what the program is, because the price demands it. This is not a starter purchase, and it is not designed to be the first thing you buy. It is the whole apprenticeship: every method course the Skool teaches, the member-only Gann lessons that are not sold on their own, the proprietary calculation tools, the video library, the first year of the applied research desk, and a standing right to everything this body of work produces in the years ahead. One enrolment. One price.
Most people study this material one method at a time. They learn to run each technique in isolation, then sit in front of a live chart and face the problem no single course prepares them for: the methods often identify different weeks, months, or market conditions. A solar-degree window may point to one week, a lunar reading to another, the Financial Time Table to a difficult year, and the dominant-cycle method to a possible low. Studied separately, each method can sound convincing. The results still conflict.
The difficulty is not that one method is automatically wrong. It is that a single-method student has no defined process for comparing the results. They may choose the method they studied most recently or the one that agrees with their existing position. That is how a useful technique can still produce a poor forecast.
The complete program teaches the comparison process. A solar-degree window receives more attention when it falls inside a McWhirter pressure window and near a Financial Time Table phase change. A cycle low may deserve more study when the World Horoscope background shows a period of wider stress. You record which methods agree, which disagree, and what evidence would invalidate the reading. That is the gap this program is designed to close.
Five method courses. One annual-forecast workflow that sells for AUD $9,997 by itself. 75+ hours of instruction. The proprietary calculation tools that take the arithmetic out of each method. The member-only Gann video studies, sold nowhere else. And one year of the desk, where all of it is applied to six markets that have not finished moving yet — the ASX 200, the Dow, the Nasdaq, the S&P 500, Bitcoin and gold.
More than a decade of reading, testing and refining the source work sits behind that list. Each method is taught in full, with its tools and the historical record that makes it worth study — and then taught again in combination, at the points where several of them converge on the same window.
Nothing is held back. Every method, every tool, and every future discovery is included for life, at the rate you lock in today.
The live forecast desk is included for the first year. It is not theory. It is a public record of dated work, and each item below is paired with its limit. None of this proves a future window will behave the same way. It shows why the timing work deserves study.
Read these four entries the way the desk asks you to read every forecast: as windows that were marked in advance and then checked against what the market did, not as a scoreboard. Each one is a single window on a single market in a single year. The value is not in any one of them. It is in the fact that the method produced a dated reading before the move, which is the only honest test a forecast can pass.
The first you already have: the November 2019 reading, and the 23 March 2020 low at 18,591.93. One detail I left out above. The same forecast also described the recovery path that followed into August — so the window was not only a crash call, it was a shape. What deserves your attention there is the gap between the date the reading was published and the date the market obliged, not the drama of the event.
The 2022 gold forecast used a harmonic target near $1,621. Gold's low that year came in around that level — the lowest close was about $1,622, and intraday prints vary by feed, so the record quotes the range rather than a decimal. A close target on one market in one year is evidence the method is worth testing, not a guarantee of the next target. A target this close can also be a near miss the other way the next time, and the desk says so plainly.
For 2022 equities, the desk called the worst year for stocks since 2008, with a Q1 peak and an October low. The S&P 500 fell 19.4%. The Nasdaq fell 33%. Markets can invert, and a correct year does not remove the risk inside it. A right call on the year still leaves every position inside that year exposed to the noise the forecast cannot remove.
In 2025, a date was set on the calendar in advance, and gold rose after it. But gold set records almost continuously through 2025, so that is not evidence and it is not presented as any here. The date held; the year does not let anyone claim credit for it. That is the honest limit of a single window read in isolation, and it is exactly the kind of overreach the complete framework is built to guard against.
This is the record you receive access to as a complete-program student, and it is also the discipline you are being trained into. You watch the windows go out before the move, and you watch them reviewed after. You see the calls that landed and the language used around the ones that did not. That second part matters as much as the first, because a forecasting record that only shows the wins teaches nothing about how the work actually behaves. The desk is included so you can study the practice in full, in the open, while you learn the methods that produced it.
Gann, McWhirter, and Sepharial are the source authors. Each method addresses a different part of the timing problem. The order below is deliberate: you establish the broad economic and historical context first, then add the monthly, date, and cycle analysis.
I. Financial Time Table — the long economic season. This is the foundation, and it is studied first for a reason. The Financial Time Table teaches you to place any market inside the broad financial climate before you look at a single shorter turn. You learn to read the long economic tide using Gann's corrected timetable work: where the season runs warm, where it turns cold, and where the pressure to expand gives way to the pressure to contract. What you learn to see here is the year, or the twelve-month window, not a date. That limit is the point. The Financial Time Table does not tell you the day. It tells you which years deserve caution and which deserve patience, so that everything you study afterward is read against the right background. A precise turn inside a warm season means one thing. The same turn inside a cold one means another. Without this layer, the faster methods produce dates with no weight behind them.
II. McWhirter Method — monthly pressure. After the broad financial context is established, McWhirter adds monthly analysis. The method compares the lunar month with a slower astronomical count — one full circuit every 18.6 years — and uses the combination to assess collective business pressure before price confirms it. You study the long cycle, the monthly reading, and the individual-stock timing layer, then check the result against the supporting factors. The Financial Time Table identifies a difficult year; McWhirter helps identify which months inside that year deserve closer attention.
III. Time by Solar Degrees — the date precision. With the season and the monthly tone established, Solar Degrees narrows the attention to specific windows. This is Gann's solar-degree timing technique: anniversaries, degree counts, ingress pressure, eclipse influence, and the process of translating solar motion into a market calendar. What you learn to see here is the cluster, the place where solar counts converge on a small band of dates. On its own, a solar-degree window is just a marked date. Read against the two layers beneath it, it becomes a window with context: a date cluster that falls inside a pressured month, inside a dangerous year. That is the difference between a busy calendar and a forecast. The course is explicit that the work narrows attention rather than guaranteeing a turn, and that a window is a place to watch, not a promise.
IV. Wheels Within Wheels — comparing cycles. This course teaches you to identify the dominant rhythm, compare nested cycles, assess cycle age, and test whether several cycles point to the same period. The objective is to prevent one cycle count from being treated as decisive without checking the larger cycles around it. A cycle low that stands alone is only a candidate. A cycle low that also falls inside a solar window, a pressured month, and a difficult financial year has more evidence behind it, although it is still not guaranteed.
V. World Horoscope — historical context. The final method adds the wider historical and geopolitical background. Sepharial's framework covers country-cycle work, long-range periods, and the conditions in which markets and policy develop. It usually does not set a specific market date. It helps you assess whether the wider period is more or less likely to contain disorder, so the shorter-term methods are not interpreted without context.
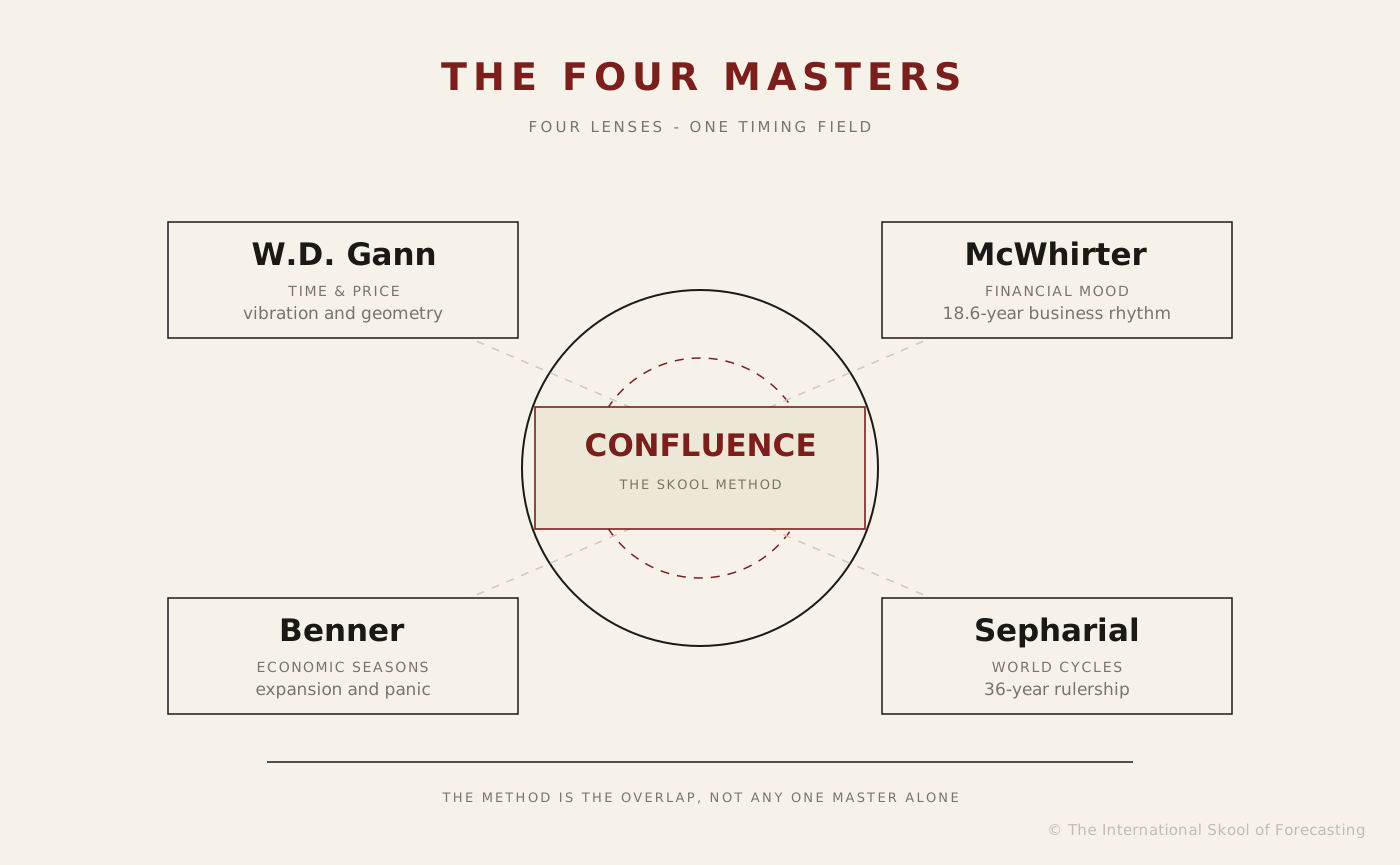
How the five combine. The Financial Time Table establishes the broad financial period. McWhirter assesses monthly pressure. Solar Degrees identifies dated windows. Wheels Within Wheels tests how many cycles support the same period. World Horoscope adds the historical and geopolitical context. Agreement across all five is not a guarantee, but it is stronger evidence than a single method used alone. The complete program teaches you how to compare the results and decide what should be treated as a watch window, a weak reading, or a failed test.
A fair objection is that a researcher can choose whichever method happened to be right after the event. That is a real failure mode. The comparison has value only when the dates and disagreements are recorded before the outcome is known. The live desk is included so you can watch the research published in advance and reviewed afterward, including the months when the reading was wrong.
The Forecaster. One full year of the applied research service: twelve monthly dossiers, the Annual Roadmap across the ASX 200, the Dow, the Nasdaq, the S&P 500, Bitcoin and gold, the Mass Pressure curves, the Master Pivot Calendar, and live interpretation of the methods in current conditions. This is where you see the five methods applied month by month across markets that have not finished moving yet.
Inside the complete program there is a body of Gann work that is not sold as a standalone course and is not available at any of the lower tiers. These are the member-only video lessons on Truth of the Stock Tape and 45 Years in Wall Street, two of Gann's own books, read closely and applied to charts rather than admired from a distance.
Most people who own these books have read them once and put them down, because the text is dense, the language is of its period, and the practical instruction is folded into passages that read like commentary. The member lessons exist to unfold that. They take the timing ideas Gann buried in his own prose and show how they behave on a chart: where the anniversaries he describes actually fall, how his reading of the tape connects to the cycle and solar work taught elsewhere in the program, and where the text has to be interpreted with care rather than copied word for word. This is the same boundary the rest of the Skool holds. The lessons show the mechanism and how to test it. They do not hand over a finished system you can run without understanding it.
These studies are reserved for complete-program students for the same reason the intake is small. They are the deepest, least public part of the work, and keeping them inside the program keeps their value intact for the people who have committed to the full path. The closely related Gann Yearly Forecast study sits alongside them as part of the same lineage of applied Gann research.
Here is the practical standard. You place the market in its broad financial period, assess monthly pressure, mark solar-degree windows, compare the dominant cycles, add the historical context, and record what would confirm or invalidate the reading. This does not create certainty. It gives you a documented process for testing a forecast instead of borrowing someone else's conclusion.
The research is not static. New discoveries, refinements, tools and forecast models are added as the work develops, and any new method course added to the library reaches you as part of the program. You are not buying a PDF archive. You are entering a research path while it is still moving.
Two things in this program move in opposite directions, on purpose. The library grows: every new method course, every new tool, every refinement and future discovery is folded into the program a complete student already holds. The rate does not: the figure you enrol at today is the figure you hold, and the member renewal you lock in stays locked while you remain active. Most education ages the moment you buy it, because the field moves on and you do not. This is built to do the reverse. The longer you hold it, the more it contains, and the further today's price drifts behind what the same access would cost a new student later.
This is for the person who has already studied enough of this material to feel the gap. They have read a Gann text or two, perhaps worked through one method, and they have hit the wall every single-method student hits: the methods do not resolve each other, and no individual book teaches the synthesis. That person is not looking for an introduction. They are looking for the whole framework, in order, with the integration taught rather than left for them to guess at. The price stops being a hurdle for them, because they already know what assembling this alone would cost in years and misreadings.
It is for the researcher who treats forecasting as a practice rather than a purchase, and who wants to enter the work while it is still active so future discoveries reach them as they are made. It is for the patient student, the one who is willing to study in sequence rather than rushing to the precise dates, because they understand that precision without context is just a busier calendar. And it is for the person who values a small room: who would rather be one of ten than one of a thousand, and who understands that the scarcity is what keeps the research worth holding.
It is just as important to be clear about who should not enrol, because the wrong buyer will not get what they came for. There are no change-of-mind refunds once access is released — this does not limit your rights under the Australian Consumer Law — so there is no mechanism to correct the mistake after the fact.
You are still deciding whether this is worth taking seriously
If you are still deciding whether time-based market study is worth taking seriously, this is the most expensive possible way to find out. Read the free library first. Study the monthly forecast summaries. Begin with a single monograph that matches the problem in front of you. The complete program will still be here when you are ready, and you will arrive at it knowing exactly why you want it.
You want trade signals
The program teaches a forecasting framework. It does not hand out entries and exits, and it is not personalised advice. If you want to be told what to buy and when, this is the wrong offer entirely, and no amount of study inside it will turn it into that.
You are measuring this against a payback period
The student who reads the price and immediately asks how fast it pays for itself has misread what they are buying. This is an education, not a financial product, and it carries no promise of profit. If the only frame you can apply to it is payback period, the honest answer is that you should not buy it.
You want to consume it all in a weekend
The program is sequenced, and the sequence is part of the value. If you do not follow the order, you will have the same disconnected set of materials you could have assembled yourself, at a much higher price.
Before I make the price argument, you should have the limit of the work — in my own words, from inside the most expensive course in the program.
In Module 5 of Building a Yearly Forecast — the AUD $9,997 study at the centre of this program — I grade my own 2024 forecast on camera. Not a highlights reel. The whole build, marked against what the market actually did, including the themes it flagged that never arrived and the places I had low conviction at the time rather than in hindsight. And what I say plainly is that it is "impossible to know when the year is going to invert" — when the shape you have mapped runs upside down against the calendar you built for it — and that this is a lack of education on my part.
That is an odd thing to put inside a ten-thousand-dollar course. It is odder to repeat it on a sales page. It is here because a student who enrols believing inversion has been solved will be angry in year two, and would be right to be. It has not been solved. I have not met a forecaster who claims to have solved it, and I have not read a book or a course that does. If one tells you it has, that is the moment to stop trusting the course, not start.
Now here is why that admission sits exactly where the price argument begins, rather than buried at the bottom.
The unresolved inversion problem is one reason not to rely on a single method. A method can produce a useful structure and still fail to identify exactly when the year's conditions will change. Comparing the other methods gives you a way to test whether a reading is supported or fragile. That is why the program is sold as one sequenced path instead of five unrelated courses.
Let me put the objection in your words, because it is the right one to have: seven thousand dollars is serious money for a course, and every expensive course on the internet insists it is worth it. Fair. So here is the only version of the argument that can actually be checked.
The five method courses are listed publicly at AUD $9,882 between them. Building a Yearly Forecast is AUD $9,997 on its own. A year of the desk is AUD $1,397. That is AUD $21,276 of separately priced material against an enrolment figure of AUD $6,997 — and those are the same prices printed on the individual pages, not a retail value invented for a value stack.
The price comparison is only part of the case. Buying the individual products separately would give you the same materials but not the sequence, the member-only Gann studies, or the instruction on comparing the five methods when they disagree. The primary value is the complete learning path and the synthesis. The price difference is secondary.
None of this came from a weekend with a stack of public videos. It came from more than ten years of reading, testing and re-testing the old forecasting material — Gann, McWhirter, Sepharial, Bayer, Benner, the solar-degree work, the financial timetables, the world cycles — against real charts. Most of that decade was spent discarding.
That is the part nobody advertises. The source material is genuinely difficult: scattered across out-of-print texts, written in the language of its period, and easy to misread the moment it leaves the page. Anyone can repeat the names. What takes years is establishing where the method holds on a chart, where it fails, which passages are load-bearing and which are period ornament, and how a modern student should test any of it for themselves.
So the claim I am making is not that I am the loudest voice in this field. It is narrower than that, and easier to check. I read the sources. I tested them against market history. I built tools to take the arithmetic out. I published forecasts before the move and reviewed them afterward in public — including the ones that missed.
The cap is not a countdown timer. Ten does three specific jobs. It keeps the private community small enough that the discussion stays useful instead of diluting into noise. It caps the number of complete-program students reaching me directly through the members forum, which is a channel that degrades the moment it scales. And it keeps the research scarce enough to stay credible — a monthly dossier read by ten people functions as private research; the same dossier read by a thousand is public commentary, and the market gets there first.
The scarcity is not theatre. Ten places means the program fills and closes. If you want the complete path, the time to decide is before that happens, not after.
Do not try to complete the archive at once. The first ninety days focus on the foundation. Start with the Financial Time Table, then study McWhirter's monthly pressure method. After that, move to solar-degree windows and nested-cycle analysis.
That order is not fussiness. It prevents the one error every beginner makes: finding a precise date before knowing whether the wider environment gives that date any weight. Precision without context is not mastery. It is just a busier calendar.
By the end of that first stretch you should be able to read a market period through something other than price — identify the larger cycle, mark the lunar background, assemble a list of candidate windows, and say out loud which questions still need price to confirm them.
Once the foundation holds, the work turns integrated. You start running the methods against each other. Does the Financial Time Table flag a danger phase? Does McWhirter agree? Does a solar cluster fall inside the same window? Do the dominant cycles confirm, or argue?
This is the part that is difficult to copy, and it is worth being blunt about why. A competitor can sell one method. A book preserves one author. A teacher on social media can repeat one famous forecast forever. None of that teaches you how the traditions interact — where they reinforce each other, where they contradict, and how to sit with that contradiction without inventing a certainty to escape it.
The Forecaster service is included for a full year because live application is where the methods stop being study and start being skill. It lets the student watch the methods applied to current markets, not only to historical examples. This matters more than it sounds. Historical charts are clean after the fact. The turn is obvious because you already know where it landed. Live markets give you none of that comfort. The window is marked while the move is still unwritten, and you learn far more from watching a thesis built under that uncertainty than from any tidy example after the event.
Each month the desk delivers a research dossier with roadmaps across six markets, Mass Pressure curves, the Master Pivot Calendar, and an explanation of how the methods were applied in current conditions. You can compare the dossier with the source courses and see which method contributed to each conclusion. The dossier is applied research, not a list of trade instructions.
A year is long enough to see the full rhythm of it: the quiet months, the pressured months, the windows that converge and the windows that fall apart. By the end of it, the monthly dossier reads less like a report you receive and more like a forecast you could have built yourself. That is the entire point of including it.
There are two halves to lifetime access here, and it is worth keeping them separate. The first half is the method library, the courses, tools and member studies, which you own outright for life once enrolled, including everything added to that library afterward. The second half is the live desk, The Forecaster, which is included free for the first year and then continues at the locked member rate for as long as you choose to stay active. The library is yours to keep with no further cost. The desk is an ongoing service you keep at a rate that never changes for you. Both halves carry forward. Only one of them carries an annual figure, and that figure is the one held still.
After the first included year, The Forecaster renews. A new subscriber pays the standard rate of AUD $1,397 a year. A complete-program student pays AUD $299 a year, and that figure is locked at enrolment for as long as the membership stays active. It is not a first-year teaser that resets later. It is the rate you hold.
The reason it is set this low is straightforward, and it is not generosity for its own sake. A complete student has already paid for the whole education once. Charging them the full desk rate every year afterward would mean charging twice for the same relationship. The locked rate keeps the ongoing desk affordable enough that staying active is the easy default, which is what keeps the small community continuous year after year rather than churning. The desk is worth more when the same people return to it, compare this year's reading against last year's, and grow into the methods over time. The low rate is how that continuity is bought.
Run the arithmetic over a few years and the structure shows itself. The standard renewal and the member renewal differ by more than a thousand dollars every year the desk continues. For a student who stays with the work, that difference compounds into a sum that materially changes what the program is worth over a lifetime, while the standalone courses and the standard desk are free to rise the whole time. You are not just buying access today. You are fixing the price of staying.
If you are weighing this seriously, you will have objections, and you should. A program at this price ought to answer them plainly rather than talk around them. Here are the ones that come up most.
You can, and for some people that is the right path. But buying them separately gives you five competent skills and no instinct for how they combine, which is the one thing that turns a technique into a forecast. You would also study them in whatever order you could afford, which is rarely the right order, and you would miss the member-only Gann studies entirely, since those are not sold on their own. Add the pieces up at their standalone prices and the total runs well past the program's enrolment figure before the desk, the tools, the member studies or the locked rate even enter the calculation. The separate path costs more, teaches less synthesis, and leaves out the parts that are reserved for complete students. The program is not a discount on a cart. It is a different thing: the sequence, the integration, and the reserved material, held at one price that does not move.
You do not, not on the strength of a sales page, and you should not pretend otherwise. That is exactly why the free library and the individual monographs exist. The honest way to test the work is to read what is public, study a single method, and see whether the way it reads a market makes sense to you. The complete program is the right purchase only after that question is already answered for you. If the page alone has to convince you, you are not ready — and there are no change-of-mind refunds once access is released to catch the mistake, which does not limit your rights under the Australian Consumer Law.
No. It is an education in a forecasting framework, not a financial product and not personalised advice. The documented record shows windows marked in advance and then checked honestly, including the limits of each one. None of it promises the next window behaves the same way, and the program is built around teaching you to hold that uncertainty rather than deny it. If you are looking for a promise of profit, no honest version of this work can give it to you.
The source books are public, and you should read them. But the material is difficult by design: scattered, written in the language of its period, and easy to misread when it is separated from market practice. People have spent years inside these texts and come away with the names and not the method. The program is the decade of reading, testing and applying that sits between the raw text and a usable framework. You are not paying for access to Gann and McWhirter. You are paying for the interpretation that makes them work on a chart, and for the synthesis no single book contains.
Tell us before you enrol. The program is the full path, and we will not ask you to pay twice for material you already hold. The point of the complete program is to put the whole framework in your hands in the right order, not to re-sell you a course you have already studied.
The program is built to be studied slowly. The method courses are yours for life, so there is no deadline for completing them. The first ninety days have a suggested order, and the live desk delivers applied research month by month. You can study the material at your own pace.
The cap is real and it serves the work. Ten places a year keeps the private community small enough that the discussion stays useful and the proprietary material stays scarce enough to remain credible. It also protects the channel where complete students reach me directly, which dilutes the moment it scales. A monthly dossier read by ten people functions as private research. The same dossier read by a thousand is public commentary. The cap is what keeps it the former.
Because the body of work is delivered in full on enrolment, so there are no change-of-mind refunds once access is released — this does not limit your rights under the Australian Consumer Law. That term is not a trap. It is the reason the entry is gated by an NDA and identity check, and the reason we would rather you wait until you are certain than enrol on impulse. The strictness protects every student already inside, and it protects you from a purchase you were not ready to make.
The method library, the tools and the member studies remain yours for life regardless. Only the live desk pauses. If you let the membership lapse and rejoin later, the locked rate is tied to a continuous, active membership, so the sensible path is to stay active and keep the rate you secured at enrolment. The library never leaves you. The desk is the part that rewards continuity.
Everything to this point has described what the program contains. The last thing to describe is what it makes of you, because that is the part the value-stack cannot price.
A student who completes one course can run one method. A student who completes the full path can compare all five methods, assess their limits, and document which evidence supports a forecast. The process moves from broad financial context to monthly pressure, dated windows, cycle comparison, and historical context. It does not guarantee a result. It gives you a repeatable way to test a forecast.
The intended outcome is practical: you can start with a blank chart and calendar, work through the methods in the correct order, and explain what each method can and cannot say. You are still responsible for your decisions and risk. The program does not promise certainty or profit.
There is also a cost to assembling this work alone. You read the same source texts without a defined order, test date clusters without a way to weigh them, and decide whether a cycle low matters without a comparison process. The result is more time spent interpreting the material and more opportunity to overvalue a method that agrees with your existing position. The program packages the source work, sequence, tools, and applied examples into one path.
And the mechanics, plainly, so nothing about the transaction is vague. AUD $6,997, once. All five method courses in the order they are meant to be studied. Building a Yearly Forecast, a AUD $9,997 study on its own. The member-only Gann video lessons, which are not sold anywhere else. The proprietary tools and calculation suites. 75+ hours of instruction. One full year of The Forecaster desk, then AUD $299 a year instead of AUD $1,397 for as long as you stay active. Lifetime access to every method course and refinement added afterward. Ten places a year. An NDA and an identity check before access is released.
That is the whole transaction, with nothing held back and nothing hidden in a footnote. If you already know you want the full body of work, the only question left is whether you take the position while it is open.
This program comes with three conditions of entry, and each one serves a specific purpose.
First, no change-of-mind refunds once access is released — this does not limit your rights under the Australian Consumer Law. The body of work you are granted is the result of years of research, and it is delivered in full on enrolment. There is no mechanism for returning knowledge once it has been handed over, which is why the term applies from the moment access is granted.
Second, upon securing your position, you sign a non-disclosure agreement. This protects the intellectual property and keeps the value of the material inside the private community.
Third, before access is released, you submit a verification photo — your face beside your government-issued photo ID — through our secure portal. Sensitive numbers (driver's licence number, passport number) may be redacted; we check only your full name, photo, and address to confirm you are the legitimate purchaser. A member of our team reviews each submission by hand. The material is not distributed anonymously. Every student in this program has been verified, and so are you. If verification cannot be approved, no access is released and we work with you directly to resolve it.
Read the free library. Spend time with the monthly forecast summaries. Get to know the work. When you are ready to commit, the program will be here. I would rather you wait than regret it — and the terms are strict precisely so that waiting costs you nothing.
P.S. In November 2019, when the Dow was at a record high and the virus was not in the news, the desk published a March low window. The Dow bottomed on 23 March 2020 at 18,591.93, about 37% below its February peak. That reading used several methods together. The Market Forecaster is AUD $6,997 once for the five method courses, the AUD $9,997 annual-forecast workflow, the member-only Gann studies, 75+ hours, one year of applied research, and lifetime access to future research. The separately listed components total AUD $21,276, but the main benefit is the sequence and comparison process.
P.P.S. Your renewal rate is the part most people overlook. The first year of The Forecaster is included, and after that complete students keep the desk at AUD $299 a year instead of the AUD $1,397 standard rate, locked at enrolment for as long as the membership stays active. The library grows. The rate does not. The longer you hold the program, the further today's figure drifts behind what the same access costs later.
P.P.P.S. The intake is ten places a year, and there are no change-of-mind refunds once access is released — this does not limit your rights under the Australian Consumer Law. That is not pressure. It is the reason the community stays small enough for the research to remain private and the reason we would rather you wait until you are certain. If you already know you want the full body of work, the time to take the position is before the year's places are gone. If you are not certain, start with the free library or a single method. The program will be here when you are ready.
Enrolment process — After payment, complete a two-minute identity check via Stripe (government ID + selfie) and sign a non-disclosure agreement. Course access is issued after both are reviewed.
Secure Your PositionLimited to 10 complete-program places per year — No change-of-mind refunds once access is released, which does not limit your rights under the Australian Consumer Law — NDA + Stripe identity check on enrolment
The Market Forecaster Program is an advanced educational system. You are purchasing access to knowledge, not financial advice. The principles taught are based on historical analysis and mathematical law, but all financial markets carry substantial risk. Past performance is not a guarantee of future results. You are 100% responsible for every decision you make in the markets. Consult a qualified, licensed financial professional before making any investment.